

A framework for Credit Portfolio Management - The secret sauce for investing in corporate bonds
Part 3: "The Bond Picking"

Good morning to all. Today is the last (maybe) part of my framework to invest in corporate bonds.
If you missed the first part (that one focused on the framework and the strategic asset allocation) here the link:
While the second part (that one that looked inside the Tactical allocation and the sector allocation decision) here the link:
The focus of this part will be on the analysis of the fundamentals of a single issuer to evaluate if the yield to risk is enough for our approach and risk tolerance. Only a caveat, all the metrics and ratios analyzed below applied to non-financial corporations (for banks and insurance the analysis different and maybe I’ll cover it in an other part). Let’s suppose that after all the process (or after a brilliant macro idea) we decide to invest in the fertilizer and agriculture chemical sector.
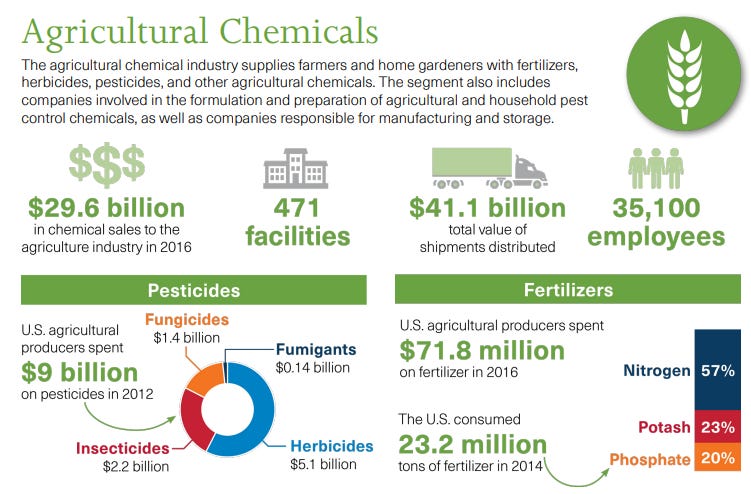
The first thing to do is to have a good picture of the sector and the various subsectors (below a great infographic of CISA - the Cybersecurity and Infrastructure Security Agency) explaining the various subsectors and what the agricultural chemicals do (fertilizers, seeds and hedbicides).

Starting from a RV scatter plot of euro chemicals names (within the BBB rating category), which includes all the various subcategories of chemicals (specialty, diversified, commodities, conglomerates) you find interesting the bond issued by OCI NV maturing in 2025 with an yield of 4% for 2 years of maturity. Let’s dive into my process divided in two parts (Business risk vs Financials risk). This is basically the same process used by rating agencies to assign rating.

BUSINESS RISK: this part encompass all the analysis focused to better undestand how the business of the company is doing over time, but also compared to competitors. Using the S&P criteria framework we can see that business risk includes:
Country risk;
Industry risk;
Competitive position (from competitive advantate to scale and scope);

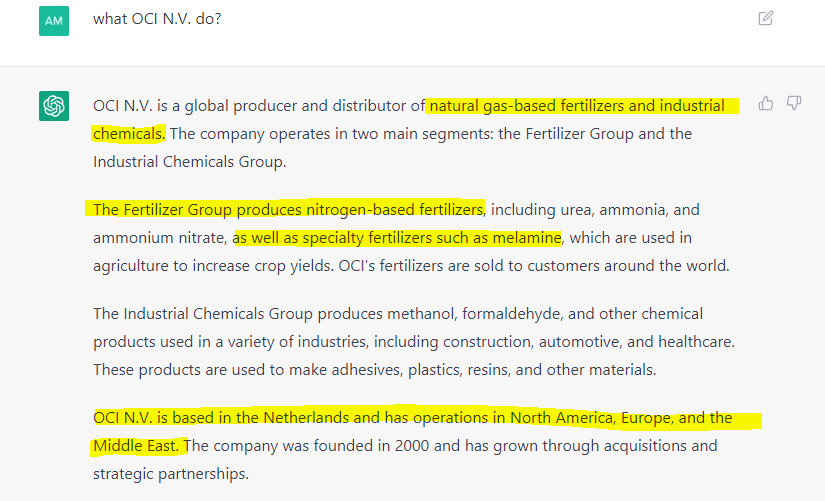
You can assess all from a quantitative or qualitative point of view but if you are not familiar with the company you are looking for I suggest you to better undestand what the company do and the strengths and weaknesses. Here web or AI can help you, try it. Below some examples using ChatGPT:

Let’s go into some numbers. The first step is to look at revenue (the top line) and EBITDA trends for the last years (minimum 3 years, best is 5 years) to evaluate the trend growth of the company over time (the direction of the business). It’s good to compare it to GDP metrics (a blend of countries if geographical focus is mixed) and competitors in the same business sector. Looking also a quarterly data add value too.
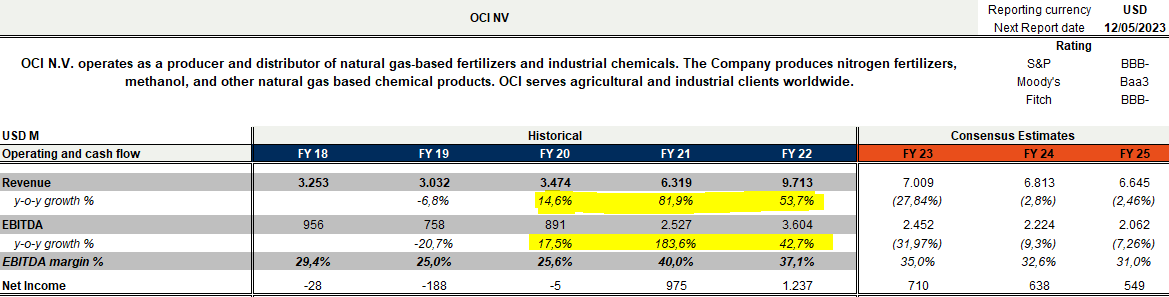
You must pay attention if the company did some acquisition/reorganization. For example here the company in the 2021 consolidated Fortiglobe, the JV of OCI and ADNOC in Middle East and North Africa.
A great source of information is the company results presentation where we can see that in 2022 revenue increased 54% with Urea price up 43% in 2022.
https://oci-global.com/wp-content/uploads/2023/02/oci-nv-q4-2022-results-presentation_vf.pdf

Prices declined slightly recently but fundamentals are good, thanks to good farmer profitability (driving fertilizer demand). The other indicator to look is the EBITDA margin (the ratio between EBITDA and Revenue) measuring capacity of company to transform profit into cash flow. If there is a lot of variability is necessary to look at single lines of cost.

Comparing it to other players in this subsector the OCI EBITDA margin is above industry average, benefiting from the synergies of the JV with Fertiglobe. This is due to strong market position but also to the access to low cost gas (used for production) in the USA.

To sum-up the business fundamentals are good (due to strong demand of fertilizers related to grains and vegetables demand). The company has good market positioning and low cost production cost base. The sector remain cyclical in nature and related to volatility of prices of fertilizers and raw materials.
FINANCIAL RISK: Here is the part of the analysis focusing on credit ratios with the aim to evaluate the ability of the company to make payment of coupons and redeem in time the maturities of bonds and loans. Let’s start with:
1) LIQUIDITY:
The two indicators with which I start the analisys are:
EBITDA / Interest Expense
(EBITDA - Capex) / Interest Expense
both are usefull to look at ability of the company to make interest payment in time. The ratio need to be above 1x. Some different versions are usefull too (using cash interest payment in place of interest expense, depending on what you want to focus on.

Always on liquidity is also very common to have a look at Quick Ratio basically a ratio between liquid assets (cash and near cash + S/T investments) vs Current liabilities. A ratio >1x indicates a good liquidity situation for the company.

2) LEVERAGE and Margin of Safety
The two most famous measure of leverage are:
NET DEBT / EBITDA (or TOTAL DEBT/EBITDA) is an income statement measure, comparing debt (total or net) to EBITDA (earning before interest tax depreciation and amortization). EBITDA fluctuates with sales, costs, etc;
DEBT to total CAPITAL = DEBT / (DEBT + Equity) is a pure balance sheet measure of leverage
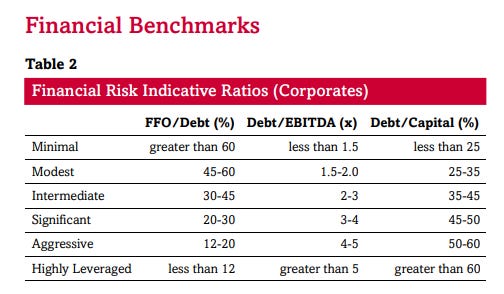
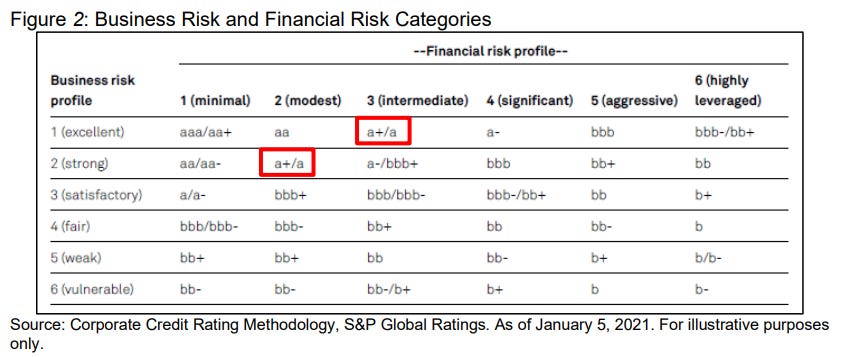
Personally I like to look at both with attention on how they move historically or vs competitors. Especially the net debt to EBITDA is a metric used by rating agencies to assign rating. Below the thresholds for some main metrics to arrive at financial risk that, combined with business risk, is used to determin the rating of the company.
“Margin of Safety” is a concept became famous with Bejamin Graham and afterward with Warren Buffet. Basically is a cushion under your investment that allow you take some losses on it without big consequences on the long term and is at the base of value investing. How it’s calculated in credit analysis? Starting with the EV/EBITDA for companies listed and compare it with ND/EBITDA. For example a 5X EV/EBITDA companies (with a leverage equal to 2.5x of ND/EBITDA. Basically the “Equity Cushion” (Margin of safety”) is equal to 5/2.5 with the company valued two times the value of is debt. Higher is better, meaning more asset value in case of liquidation.
3) FREE CASH FLOW RATIO (FCF): Before to look at the ratio, FCF is basically the cash generated by the business activity and usually should move in line with earnings of the company. FCF is the most used indicator of cash flow, a source of liqudity for the company and is calculated as below.

The ratio FCF/Debt is a measure of ability to meet obligations or how fast the company can deleverage through the cash flow. Higher the ratio, quicker will be the deleverage ability. It’s for that I analyzed it after leverage measures.
SUM-UP
We have looked at business risk looking at revenue and EBITDA trend but also competitions and cost forces (considering EBITDA margin). My first rule is to understand the business and invest only in business when I really undestand how the company can growth and how company can make money. It’s for that I start investing from a top-down point of view (business cycle is good, buy cyclical business and viceversa).
Rule of thumb: a company with low business risk can usually sustain a high financial risk (high debt level) due to stability of revenue and cash flow.
To compare companies in the same industries some credit ratios were analyzed relating to liqudity (ability to pay interest), leverage and cash flow (ability to repay debt). Here the basic of financial risk analysis. Be curious and explore details of presentations and reporting.
As usual if you liked it, share this piece and subscribe to my regular weekly update.
Thanks so much. Looking forward to the banks' analysis.
Great take that's for sure ... nice to use & show a use case with ChatGPT for research. I started using it also for some selected dividend stocks. Thank you!