

A framework for Credit Portfolio Management - The secret sauce for investing in corporate bonds
Part 2 "The Tactical Asset Allocation"

Good morning to all. As promised today I’ll talk about the second part of my framework to invest in corporate bonds.
If you missed the first part (that one focused on the framework and the strategic asset allocation) here the link:
Before to start remember to share this piece if you like it and to subcribe to the newsletter and share it.
Just as a recap the Strategic Asset Allocation focus on the determination of the beta in your portfolio, basically how much risk you want to have. Can be thinked about the weight of corporate bonds vs a benchmark (or vs cash) or the credit duration too.
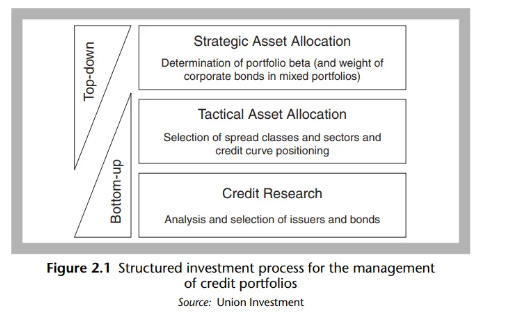
The Tactical Asset Allocation
In this part of the process (usually each month) there is the selection of the different spread classes (senior vs subordinated, rating based HY vs IG, or sector choice). This is function always of the past point (if you are bearish on credit usually you prefer senior to subordinated debt, IG to HY and defensive sectors to cyclical one).
The process is not always the same because as explained before my framework help me (and force me) to look each time at least at this components. Eventually in same cases some components matter more than others, while new drivers could emerge and were not considered before.
As my process is based on a top-down flow I know that a great part of returns are explained by the asset class choices, the sectors selection and only at the end of the day by the name selection. So I start to look at macro indicators and micro cycle, I continue looking at credit fundamentals of the varios sectors and at the performance of each sector against the others.

A - Macro Cycle
In this part of the process I give a tilt on some sectors based on the macro regime and the beta derived from the Asset allocation Process. As a proxy of the growth cycle I use the PMI indicators (a blend of services and manufacturing PMI).

As a rule of thumb if leading indicators are decreasing (as in this moment and since the end of 2021) a defensive position is required. That mean to prefer:
Defensive vs Cyclicals sectors;
Senior vs subordinated issues;
IG vs HY (the same concept apply in a HY only portfolio, preferring BB to B/CCC ratings).
while if leading indicators are increasing a pro-cyclical position is needed. That mean to prefer:
Cyclicals sectors vs Defensive;
Subordinated issues vs seniors;
HY vs IG
The ratio is that when economic cycle is weakening, consumers reduce discretionary spendings (like a new auto) and focus more on basic necessities as food and healthcare. Credit markets, like FX, is one of the most reflexive one. That means that the perception about the fundamentals impact the fundamentals, that in turn impact the market price (the spread in this case).

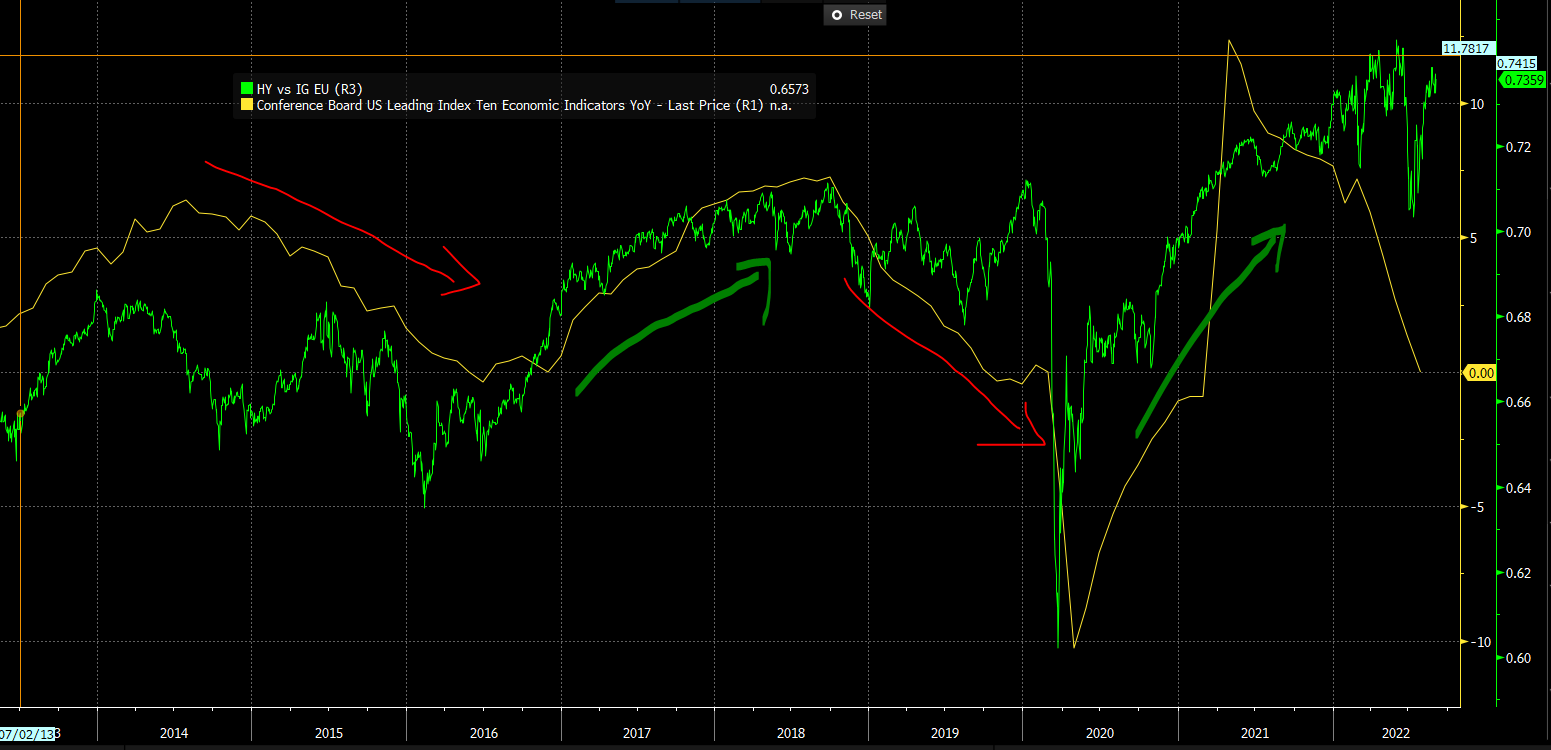
In the chart below a practical example of what happen in practice. Here I used the LEI indicator (US based) in yellow, while in green the ratio of HY vs IG ETF. It’s evident that HY perform well in good economic environments, while underperforming in weak periods.
B - Micro Fundamentals
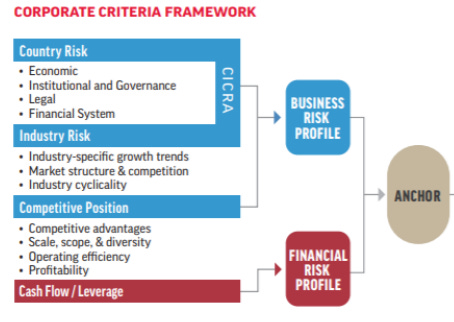
As we will see also in the last part of the process (the issuer selection) I like to see at credit market through the double lens of business risk and of financial risk. This is the approach used by rating agencies:
Business risk measure the capacity of a company/sector to increase revenue and to mantain high margin. A company that in this environment (of high inflation) is able to pass the cost to customers has what is called “a good competitive position”. For this part I look at sector that have a good revenue and EBITDA growth, with high and stable EBITDA margin (one the most looked indicator of profitability).
Financial risk measure the ability of the company to pay theirs obligations and how it spends money earned (if it prefer to remunerate shareholders or bondholders, to invest in new project, etc). For this part I look at sectors with high cash flow generation vs debt, issuers/sectors with lower (or reducing) debt vs EBITDA and with higher coverage of interest.
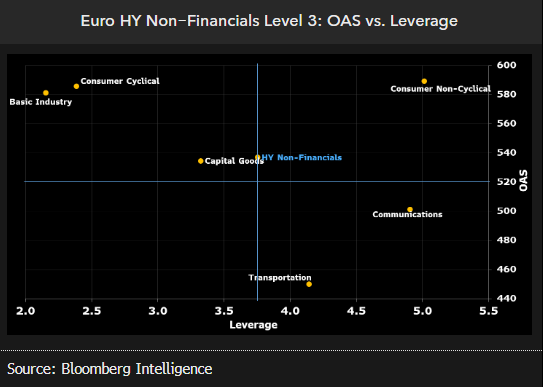
Here a chart for Bloomberg plotting leverage for various sectors vs their spread. This could be a first step to look at cheapness of one sectors vs the others.
I aggregate the above micro fundamentals indicators (Business risk, financial risk and cyclical tilt) in a scoring system. Below you can see for example that energy sectors has one of the best business risk indicators (high revenue growth, high margins) together to a high cash flow generation that give them a positive financial risk indicator.

C - Relative value
Despite fundamentals don’t change so fast, valuation can move extremely fast. As said above credit is a high reflexive market, that can drive valuation extremely wide or tight vs fundamentals. It’s for that reason that relative value, or valuation, offer good opportunity.
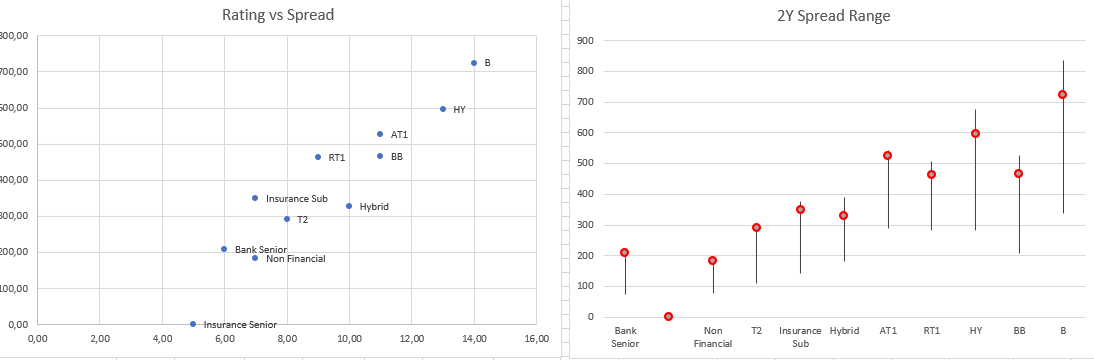
Below I use a chart of rating spread, but the same concept could apply at sectors or subordinated/senior ratio.
High rank various measure of valuation and I aggregate in one score indicator.
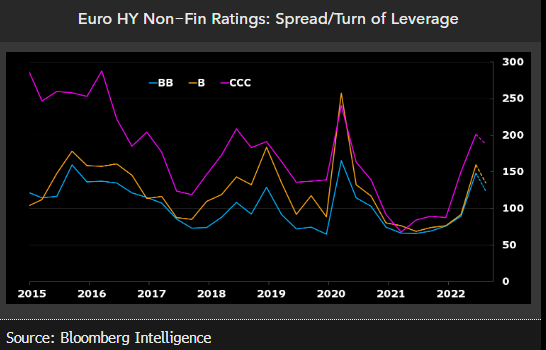
Spread per turn of leverage (spread : net debt to EBITDA);
Spread vs duration;
Spread vs history (on a 6M, 1Y, 5Y period)
Here you can see some example of it
FINAL SCORE
After looking at all parts I aggregate cycle, micro and valuation all together arriving at a final score. It’s a never ending process (and most of process is in my mind too).
This is only an example and sometimes I arrive at trade idea with other methods (starting from a news or looking at capital cycle drivers). This piece is only an example on how to structure you decision being disciplined at looking always a minimal set of information.
In the next and last piece we’ll look at single name selection. I hope you enjoyed it and in case share it free to friends or colleague.
Bye.
Great overview, thanks for sharing it!
Superb! Im glad i earmarked this article, thanks!