

Fixed Income à la carte
A monthly view of fixed income markets

Good morning everyone. This is a first attempt of a monthly piece on worldwide rates (or a part of these) and fixed income. I've had a lot of requests about this, following a thread made last year that descring all the toolbox available for a fixed income guy (you can find the original thread here). In the first part of this piece I will focus myself on what happened on the market while later, if I see some opportunities or dislaction, I will talk more about possible trades.
MARKETS MOVES (DURATION and CURVES)
Developed markets (USA, Germany and UK) rates remained in a range - soft declining trend for all the month of July while, rallied strongly after the FED meeting (that mantained rates on hold again, despite some pressure to cut already in July).

This created some panic of a FED behind the curve after a series of data weaker than expected and in deteriorarion (below the negative reading of US and Eurozone surprise index). The panic accellerated after the publication of the friday NFP (payroll data), that showed weaker than expected job creation and jobless rate increasing from 4.1% to 4.3% in July (triggering the famous Sahm rule).

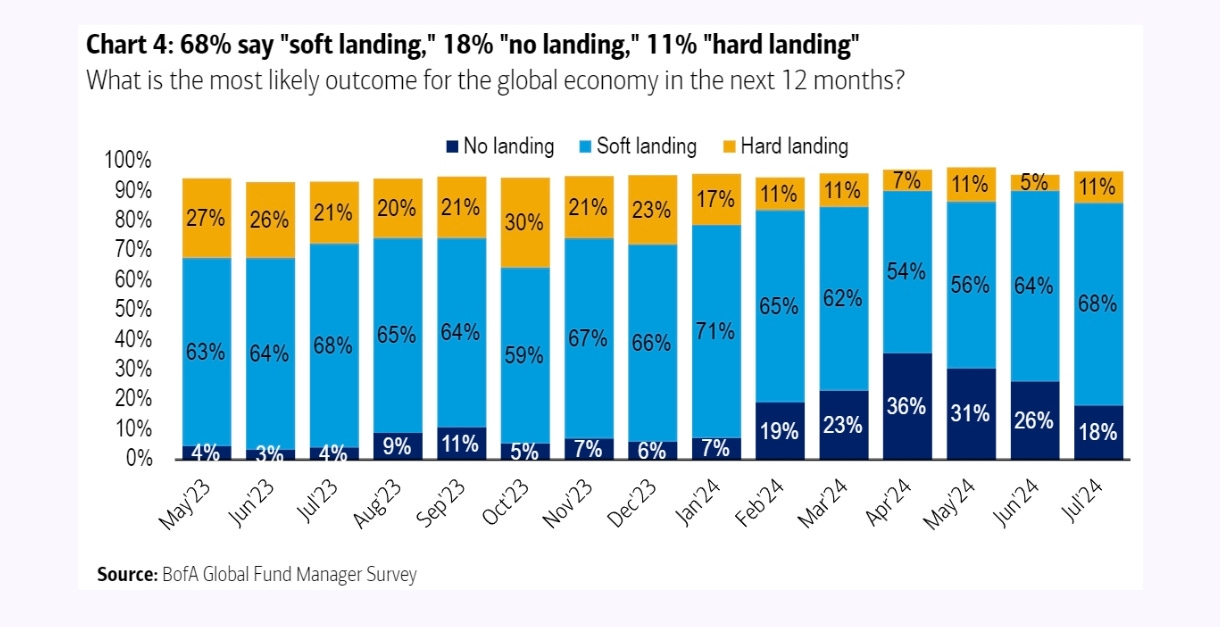
The move, based on fundamentals (macro) was exacerbated by technicals (summer low liquidity), in particular on too crowded sentiment/positioning. The soft landing scenario, in the last BofA survey was the 68% of opinions, while only 11% of them expected an hard landing.
At the bottom of the move, US 10y treasury yield arrived at 3.66% (from above 4%), while 10y Germany bund arrive nearly at 2%. In the last 2/3 days with investors trying some bottom-fishing in equity and risky assets, yield they have recovered a good part of the movement, with some profit taking of the most speculative parts of trades.
On the curve, below the German curve (but for the US the movement was similar), almost all piece of the curve steepened, in the classical manual pattern of bull steepening, with more cuts price on the short term part of the curve. Here in the chart below I used HSA function on Bloomberg.
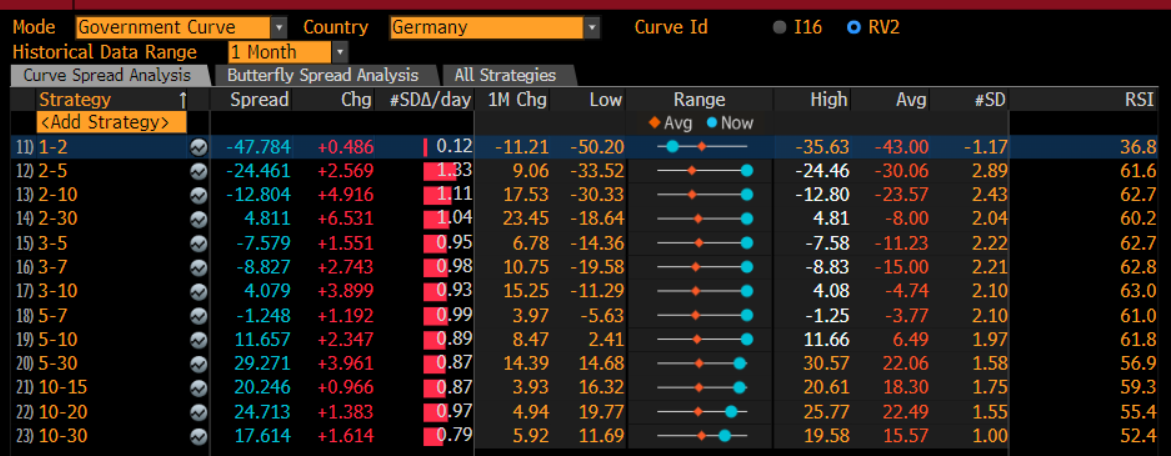
Only the very short term part (1-2) flattened, with more cuts added in 2025 and 2026. Below you can see the ERZ4-ERZ5 (Euribor dec 25 vs 26) now pricing almost 75/80bp of cuts vs 50bp at the beginning of July.

Looking at the fly (these type of trade require being long/short/long or short/long/short 3 differents tenor of the curve), the body of the curve underformed with 10y widening vs 5/30 and vs 2/30, and 5y underperforming vs 2/5.

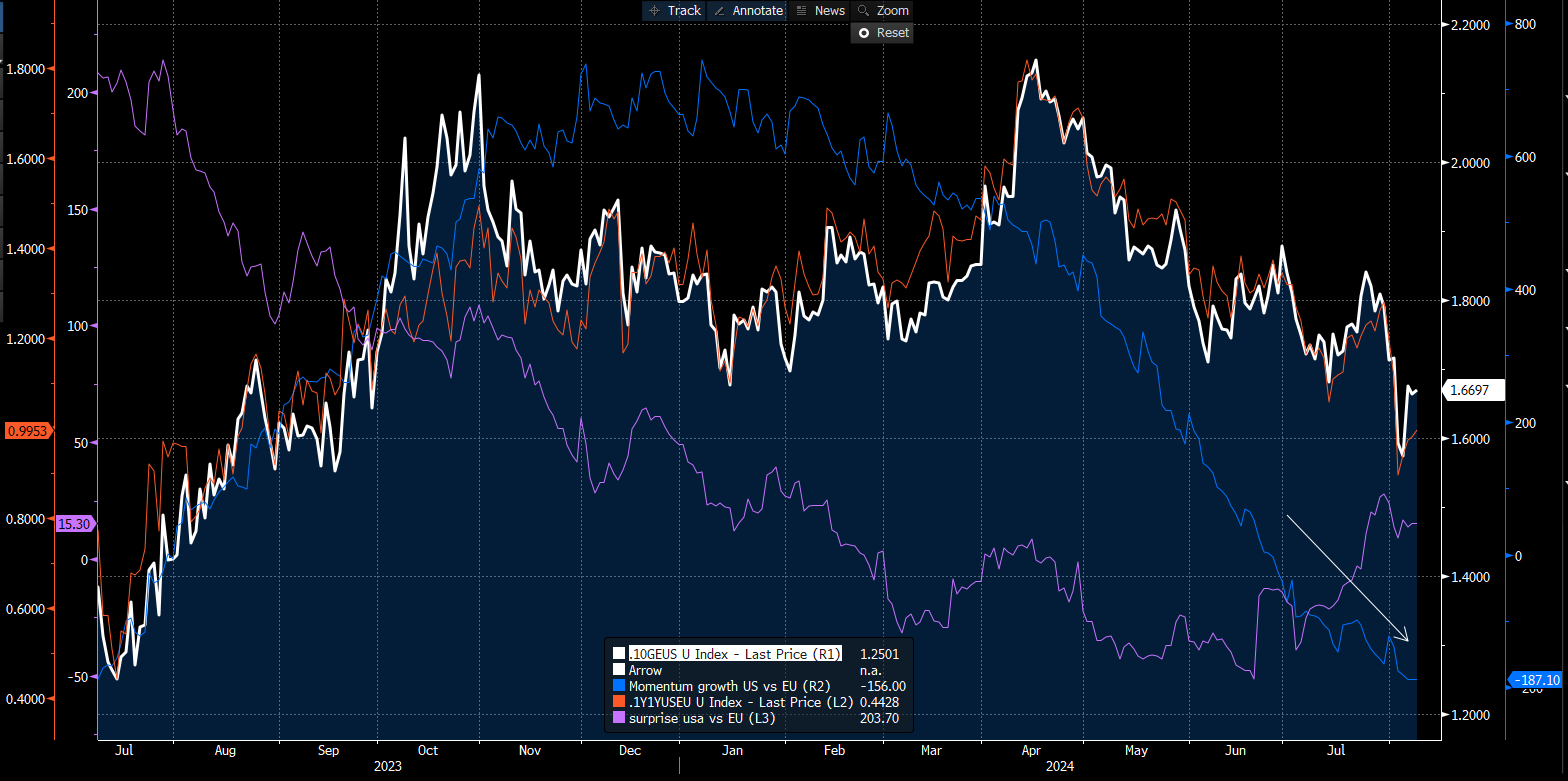
This is due to the fact that the body of the curve is driven more by uncertainty (who knows what will happen in 2 or 3 years) and by volatility. I added at the chart in blue the ASW spread of bund (a rising spread means investor prefer holding bund vs swap) and in purple the ATM volatility of bund.

MARKETS MOVES (SPREADS)
Country spreads across countries in Eurozone widened from mid-July after election in France and risk-off events in the month of August. BTP-bund spread remained well inside the range between 120-150bp, while OAT-bund widened near the top of the range. I am positive on BTP-bund and I think the top of the range could be a good entry point for mid-term view on spread. Fundamentals remains positive for perhiperal bonds (PMI were better than for core) and carry is supportive. I am less positive on OAT-bund, with deteriorating fundamentals and a splitted parlament/government environment.

Inter-atlantic spread (US-Bund 10y spread) tightened, following the derioration in macro momentum in US (last series of data) and the confirmation of a dovish trend in inflation. The fear of FED being behind the curve, and forced to cut more later accellerated the trend, with the spread between US 1y1y OIS and EU 1y1y OIS collapsing from 120bp to 100bp in only some days (in orange in the bottom chart).
Given this context below I will explain in more details where I see more opportunities for the next couple of weeks.