Welcome back to a new post of “Credit from Macro to Micro”, in today's piece I want to analyze the market with you, through a hybrid analysis of fundamentals and technical analysis. The analysis will be on the american stocks market (SPX), but the same type of analysis can be done on all types of markets.
First, let's define the fundamentals. Can be either macro (GDP, Central banks decision, etc) or micro (EPS, revenue), if we are talking about a specific sector, a specific company or a particular commodity.
While by technical we mean everything that concerns graphs (trend, momentum) and various indicators (breadth, sentiment, etc).
I have always believed that a fundamental-only approach (looking only at balance sheet data) was lacking because it was not very reactive to what was currently happening on the market, while I have always found the purely technical approach to be mentally unsatisfactory (I always wanted to rationalize my positions).
Reading the stories of many of the greatest macro traders I then understood that many of these are based on a hybrid approach, which mixes fundamentals and technical factors, being able to encapsulate it all in one sentence one could say that "the best trades are those where fundamentals and technicals are in line with each other".
This was the philosphy of Amos Hostetter, one of the father of Commodities Corporations (where a lot of famous traders as PTJ, Bruce Kovner, Ed Seykota started their career). Below his manifesto, but to sum up:
Fundamentals need to be supportive;
Follow the fundamentals in your trading, as long as charts do not cast a negative vote;
His attention was also on price action vs newsflow (as a sentiment check). “Bullish response to bear news, or vice-versa, means that the price had already discounted the news and the next move will probably go the other way.”
Now let's see what the message of the various components is.
FUNDAMENTALS:
Soft vs hard data
We are seeing widespread weakness in soft data (which are mainly leading indicators), starting with consumer sentiment (driven by both fears of tariff growth and the upward impact of inflation) and the FED regional PMIs (also impacted by the decline in future orders, due to tariff uncertainty).
On the other hand, we still have stability in hard data. The chart below shows the surprises to these components.
Leading vs coincident
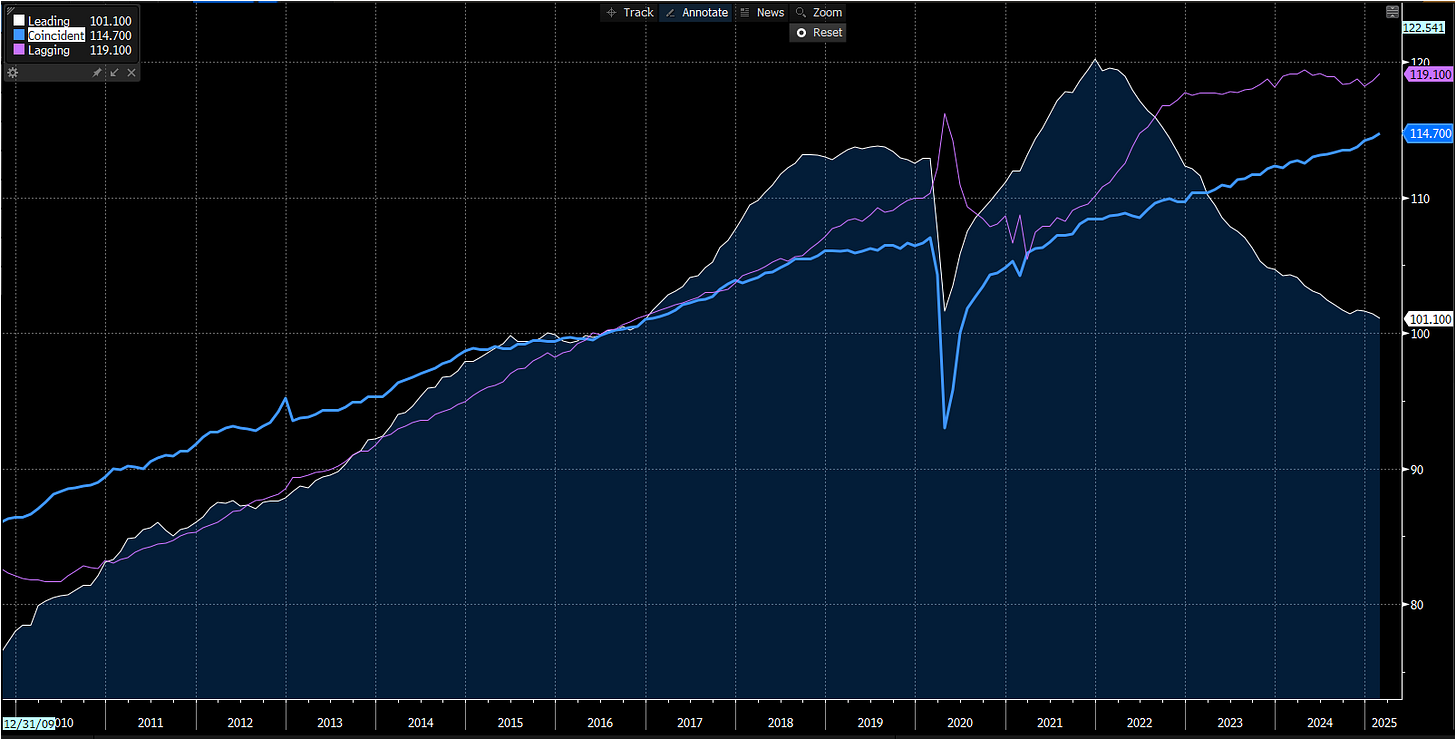
The same divergence is appreciable when looking at leading data rather than coincident and lagging ones (in this case we are usually talking about the labor market, whose weakness comes later in the economic cycle).
GDPnow vs Nowcast
Much uncertainty is also evident when looking at the sharp drop in GDPnow calculated by the Atlanta FED. The sharp drop in growth estimates (caused by the increase in gold imports, as well as those trying to anticipate the duties) have driven the sharp drop. In the link below you will find a very good explanation of the differences (with pros and cons) between GDPnow compared to various nowcasts (such as those calculated by NY FED and ST Louis FED), which on the other hand have seen stability in their "growth estimates".
https://realinvestmentadvice.com/resources/blog/gdpnow-or-nowcast/
Internal market indicators
“The best economist I know is inside the market” (Drucknmiller). This means that various analysts, funds managers trading the market know probably better the me and you the fundamentals of various names and sectors. So looking at relative performance of cyclicals sectors vs defensive one could give as a good indicator of economy future path. Below the confirmation as this ratio leads ISM manufacturing.
Earnings revision trend
The fall in cylical sectors is reflected in the decline in earnings estimates (here I use Citibank's ERI earning revision index). Revisions have been falling for a few weeks and only recently the ratio of new orders to inventories (also a leading indicator for the ISM) has collapsed confirming the indication coming from expected earnings. Hope can come here from a weak dollar (one of the priorities of the Trump administration), in the inverted chart below (in green).
Liquidity
Liquidity is the most important fundamental driver for the market. In the broadest sense it includes not only liquidity created by central banks directly, but also implicitly by commercial banks (through lending activities) and the fiscal component, to finance (and the supply of bonds). One of the various proxies I use (although not perfect) is that of FED liquidity:
FED Assets - Reverse Repo - Treasury General Account
Recently TGA decreased, with Treasury using almost 500bln, increasing liquidity, while in the next week this buffer will be rebuild (going into tax payment season).
This is the seasonal path of TGA. In the next week households/companies will pay tax, with Treasury which will replenish the buffer. This will be a liquidity tightening event, impacting market for some weeks. One factor that could dampen this could be Trump's announcement of new expansionary fiscal measures (such as the confirmation of tax cuts), after an initial period in which he anticipated tariffs ahead of everything else.
For more details on the fiscal side and the fiscal impulse have a look of this chart (and the full piece here (https://substack.com/home/post/p-159820652?source=queue) of my friend SpaghettiLisbon where from a seasonal point of view the fiscal flow (payment for tax vs benefits from government) will be negative next couple of weeks.
TECHINCALS:
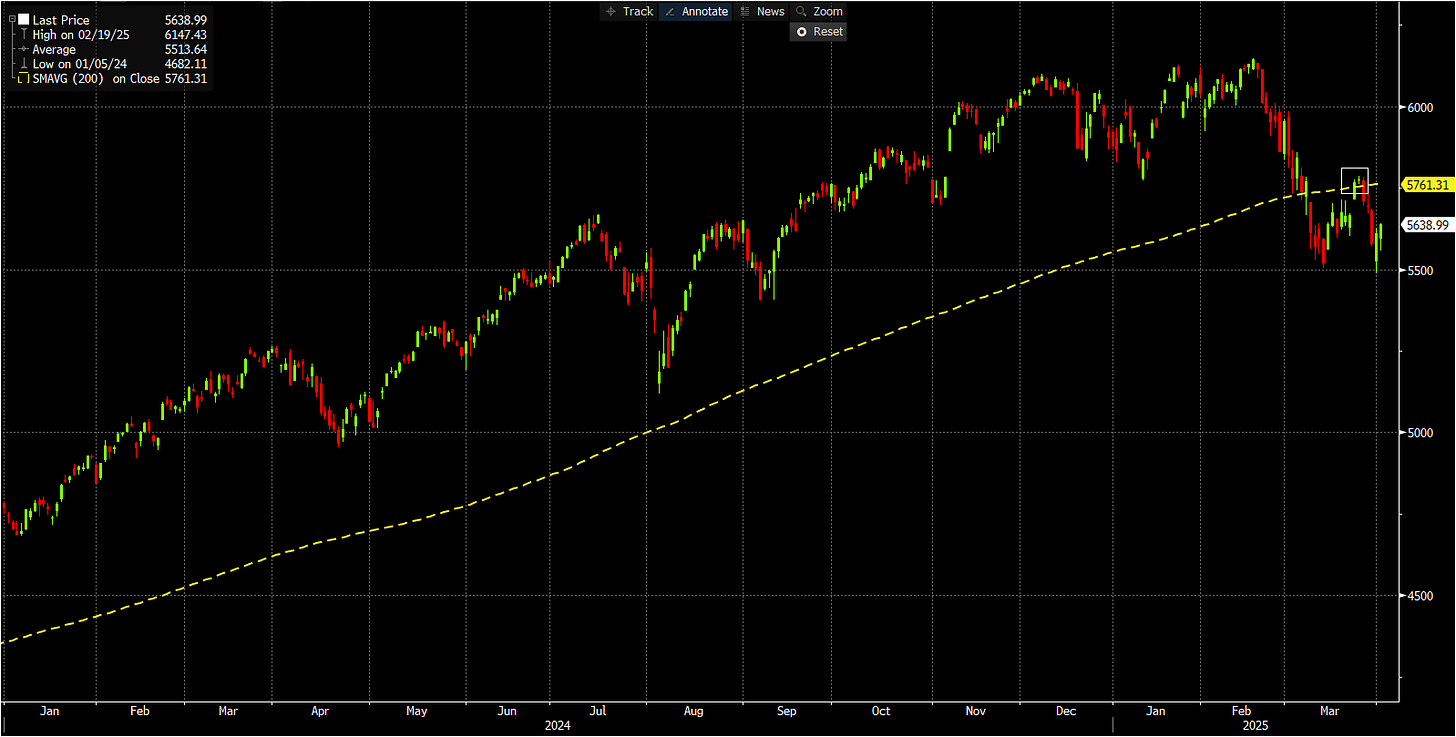
“Nothing good happens below the 200 day moving average” (Paul Tudor Jones").
“The trend is your friend”
Looking at the trend is the first thing to do, regarding technicals, together to price action (a single candle, a series of candle or a particular pattern as a H&S). Recently SPX crossed below the most important moving average and failed the rebound again. While some rebound could happen in next days (RSI diverging from price action) the trend remains in bearish area.
But technicals are more than trend and it includes a whole series of indicators ranging from market depth, to sentiment, positioning and liquidity. Below a scorecard to have a list of things to monitor, but it is not exhaustive because some others factors could be included in particular periods. The framework is inspidered by the fantastic job I read in this years of MacroOps. I tried to normalize every indicator to from -2 (very negative) to 2 (very positive), while the total score goes from -6 to 6. Now let’s go into the details of every single sub-technicals.
1- Sentiment
Sentiment is negative and pointing to a buy signal (on average). AAII (American Individual investors) are very bearish at the moment, with the bear to bull ratio below 2 standard deviation. Usually this level is associated with a good payoff in the following month.
Also other indicators as that one coming from BOFA Fund managers survey says that equity allocation dropped 29ppt MoM to net 6% OW…biggest monthly drop since Jul’22, and 5th largest on record.
Equity allocation is now the lowest since Nov’23, with current allocation is 0.7 stdev below its long-term average.
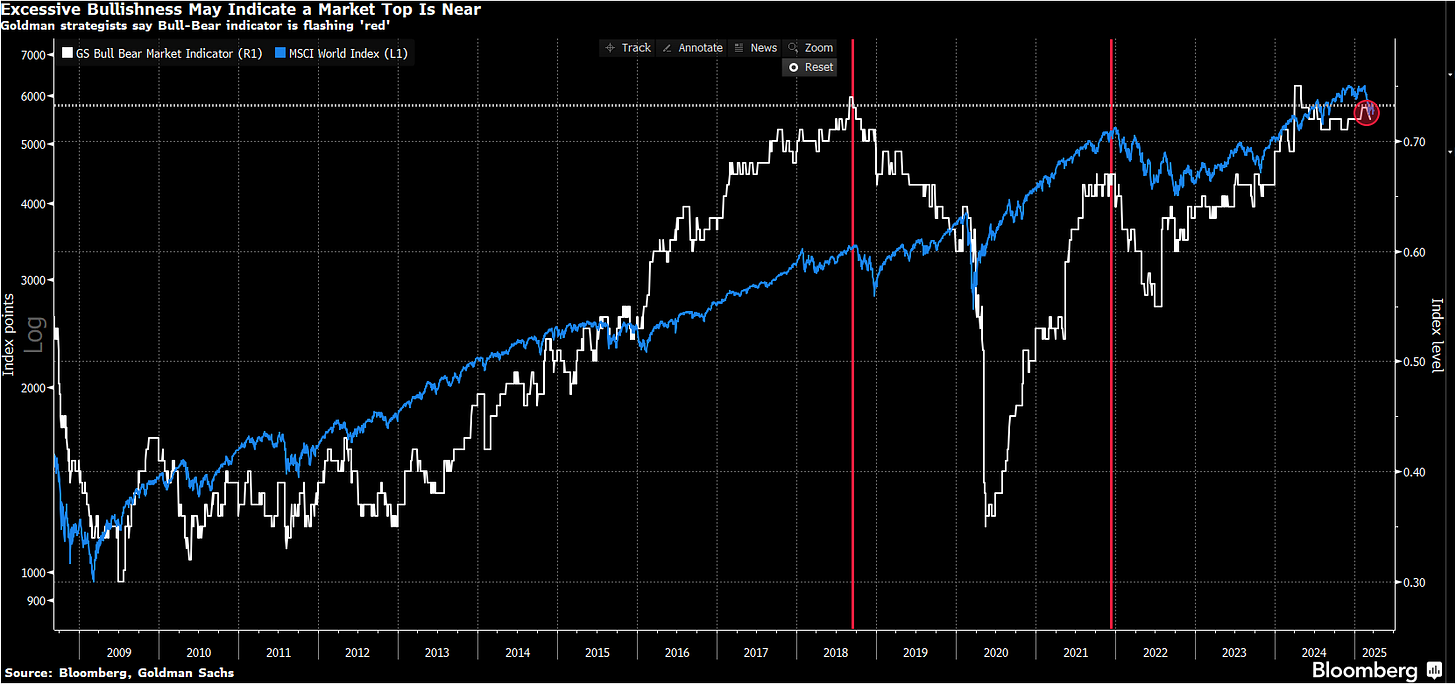
At the same time GS Bull-Bear market indicator remains in a bullish area (so pointing to more deleverage going forward. Ore indicator in the scorecard is so negative for us.
Option activity is in a no-man zone. Uusally put to call ratio increase into a big sell-off (with put vola increasing with money managers and traders adding to downside protection buying put). Now the ratio is in the middle of the range, rebounding from the bottom, but with call volume decreasing, while put volume remains low from historically point of view.
The same neutral read come from looking at skew (or risk reversals). I use a normalized version of this but the concept is easy. If there is a lot of hedging activity, the volatility of put will be higher than that one of call. So if the spread below (1M and 3M call less put volatility) fall it means that there is a high panic and hedging activity. This is not happening, probably due to the fact that investors derisked yet their portfolio, so nothing to hedge. The level is not enough extreme to signal a strong buy indicator.
2 - Liquidity
I talked of liquidity above in the macro part, that was driven by central banks (and banking system) and fiscal impulse. This part is more market oriented but it’s true that some indicators are in the middle of the two bucket.
In this environment corporate bonds (here expressed via LQD ETF) are underperforming vs government bonds. Credit is growth, as the credit generated via banking system is as a monetary multiplier, so what is happening is a tightening in financial conditions. The same is happening also with SPX underpeforming the bond market (also expressed via ETF SPY vs TLT).
3 - Breadth
By breadth we mean how widespread a rally or correction is across sectors or names. Also here we have an overlap between fundamentals and technicals, where we looked at the intermarket analysis of cyclical vs defensive. If the sell-off is widespread it is an indicator that we can be near a bottom, while a new rally will be driven by only some sectors or names. While if the sell-off is driven only by a part of the market, something more could happen.
There are various measures of breadth to look at as:
advance vs decline
% of members at 52w high or low
% of members above or below various moving average
In the scorecard I inserted only some of these but using WEIB function of Bloomberg we can analyse more of them.
Using for example the moving average indicators (% of members above 10, 50 and 200 moving average) we can see that all are near a 50 value, an average level. So half of the names are above the various moving averages (included the 200 day moving average, considered an important level between a bear or a bull market). Various past bottom are accompanied by levels (at least of the 10-day moving average) at more depressed levels, below 20%. We are not there yet.
FINAL CONSIDERATIONS
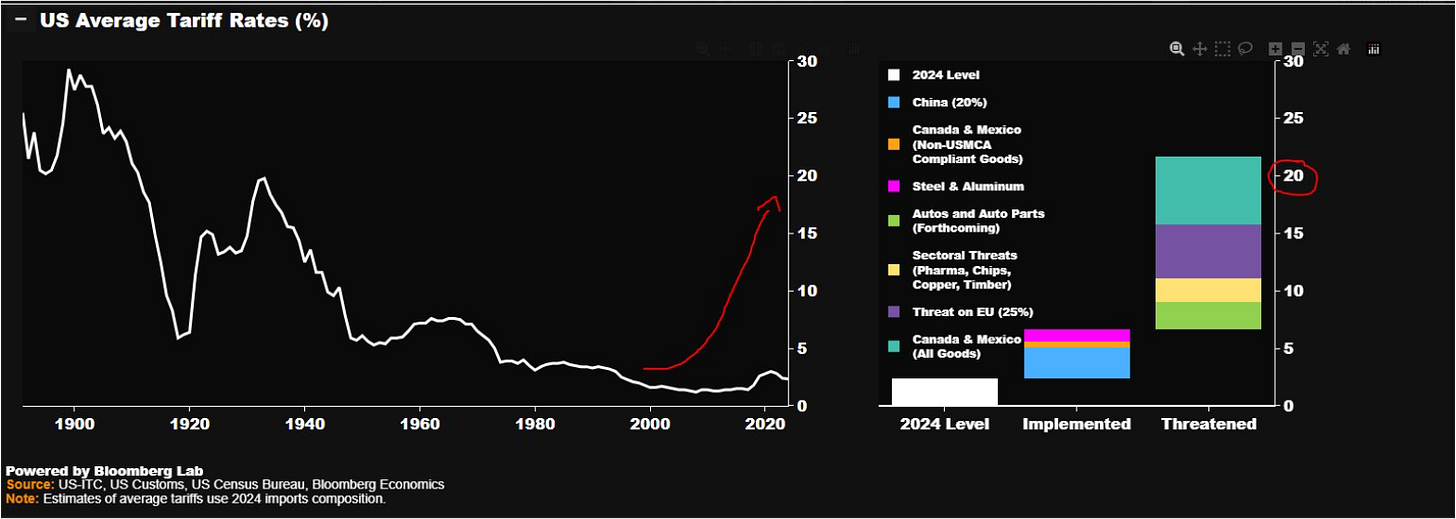
Today is "liberation day" and we will probably see a lot of volatility again. We are not yet sure at what levels the tariffs will be set (probably between 10-15%, which is a historically high level).
The effects on growth and inflation are still uncertain and could be multiple. Using Bloomberg analysis, US GDP could be impacted by 3-4% in the most negative scenario.
The framework I presented today is a mental framework that helps me, and could help you too, to have an idea of the possible impacts on the market. In the end, our work is based on allocating risk based on different future scenarios. We do not win if we guess the macro scenario that then materializes (especially if this is already priced in by the market).
It’s all for today. If you liked reading it and want to support my job, please share this piece to friends and colleague and subscribe to the newsletter using the link below.
See you soon.
Credit from macro to micro.


