Inflation linkers guide
Everything you always wanted to know about inflation but never had the courage to ask
Morning to all readers, finally I fineshed to write this guide to inflation linkers and products. It’s long and divided in various piece looking at:
macro concepts, seasonality
technicalities (lag, carry, beta and how construct your own curve)
trading strategies (real yield, B/E, ASW and Iota)
Good read.
MACRO CONCEPTS
What is inflation and how is measured?
Inflation is the increase in the overall price of goods and services over time. It's measured using Consumer Price Indices (CPIs), which track the changes in prices of items purchased by households. The inflation index is an aggregation of different components (basket), which varies over time and with different weights. The aim is to try to measure the cost of living for the majority of the population. These indicators are used for various purposes, including guiding monetary policy, indexing contracts and benefits, deflating national accounts, and calculating changes in consumption or living standards.
Indices are based at 100 at a initial arbitrary date and calculated monthly. Changes of this indexes are then comunicated versus the previous month (MoM) or previous year (YoY), despite are also usually other representation (as the 3 months changes).
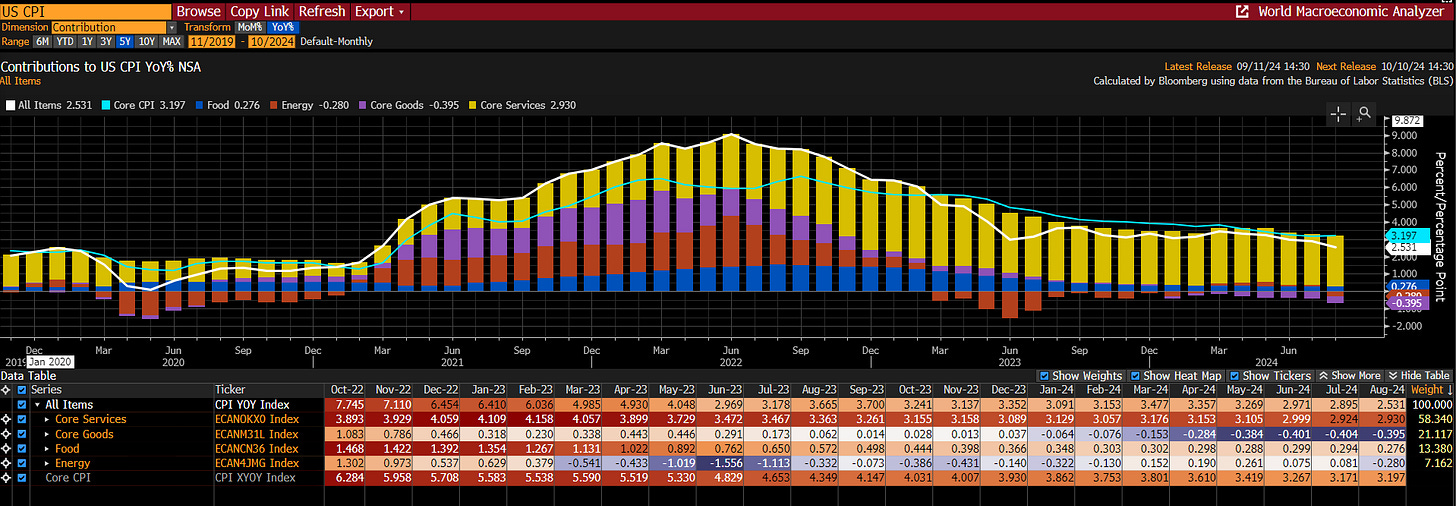
Below we can see the CPI inflation data for Unites States on a year on year point of view. You can see a common breakdown of the inflation with:
a core inflation (goods and services)
a food component
an energy components
There are a lot of breakdown used by analyst but the most important thing is that food and energy are the most volatile components. This type of breakdown is usefull and enough for a rapid modelization of various components.
For example the Energy YoY component could be tracked using a 12 month change of oil and gas with a lag, while the core services inflation is well explained by wages(as shown below using european inflation data).


