
Weekly Credit Market Review - Aug 19
Weekly Credit Market Review - Aug 19
A thread from macro to micro

Welcome back to all readers. Before starting just a note of service. Next week I’ll be again off. I needed to break-up my holidays in two and I have to take back my son and my wife that remained at the sea!
As always if you like my job/analysis please subscribe below and share it and I remember you that I am also on twitter at @Credit_Junk.
And now let’s look at what happened this week.
MACRO/NARRATIVE:
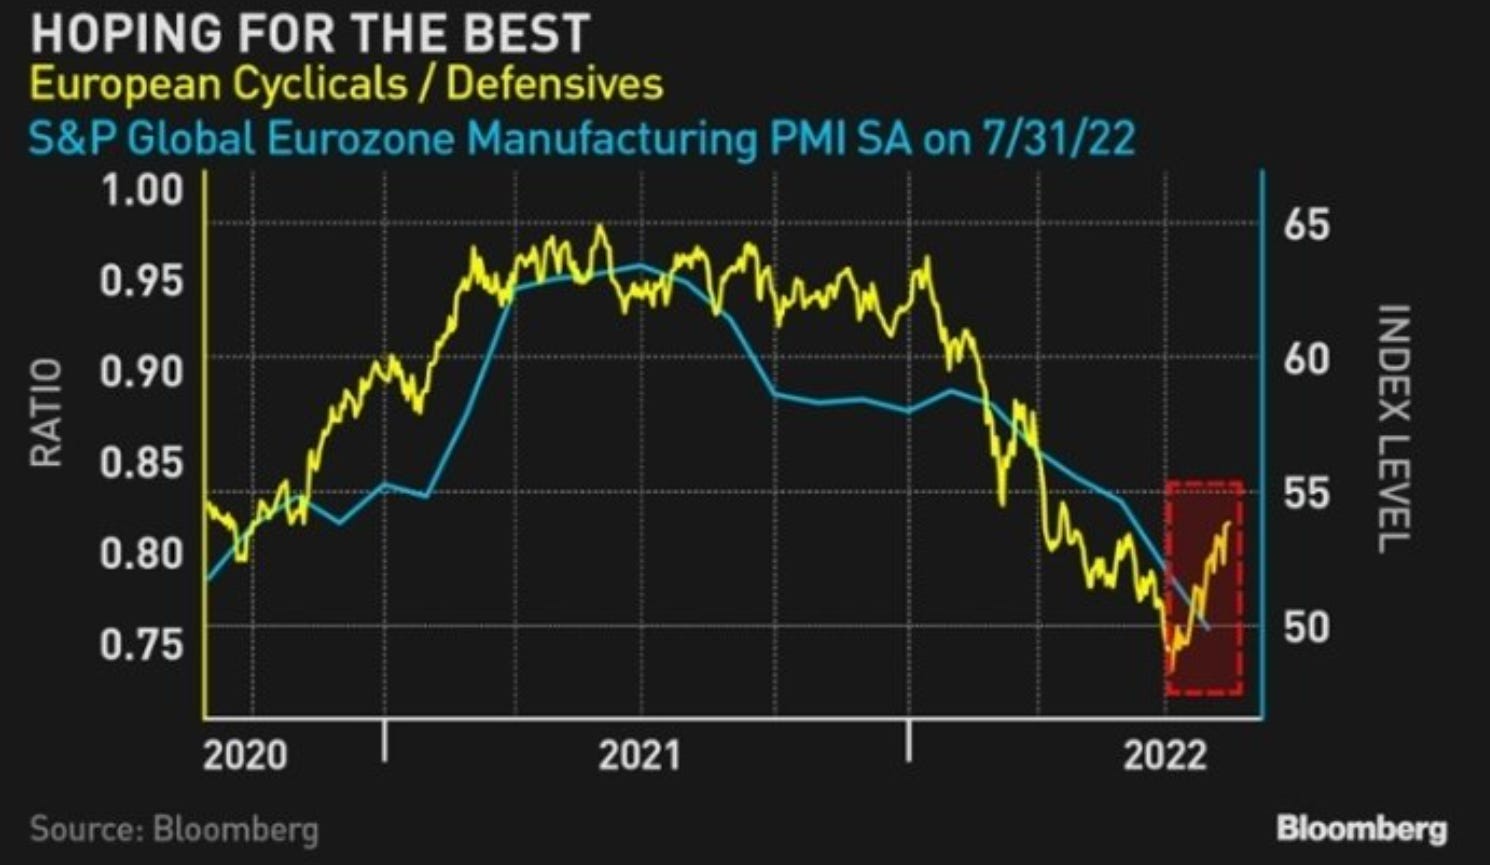
Starting from the idea of my splitted holidays I have decided to divide events and narrative of the week in two. The first part of the week was characterized from growth fears, while the second part by the inflation. Taken together this is a confirmation of a “stagflationary environment”, especially for Europe.
In the chart below I plotted the 10y interest rates for US and Germany with annotated events.

Part 1: The week started as said with focus on growth risk after the publication of weak economic data in China:
Retail sales 2.7%; est. 4.9%
Industrial output 3.8%, est. 4.3%
Home sales -28.6%
Property investment -12.3%
Youth unemployment to a record of 19.9% (especially this one is a risk for social stability)
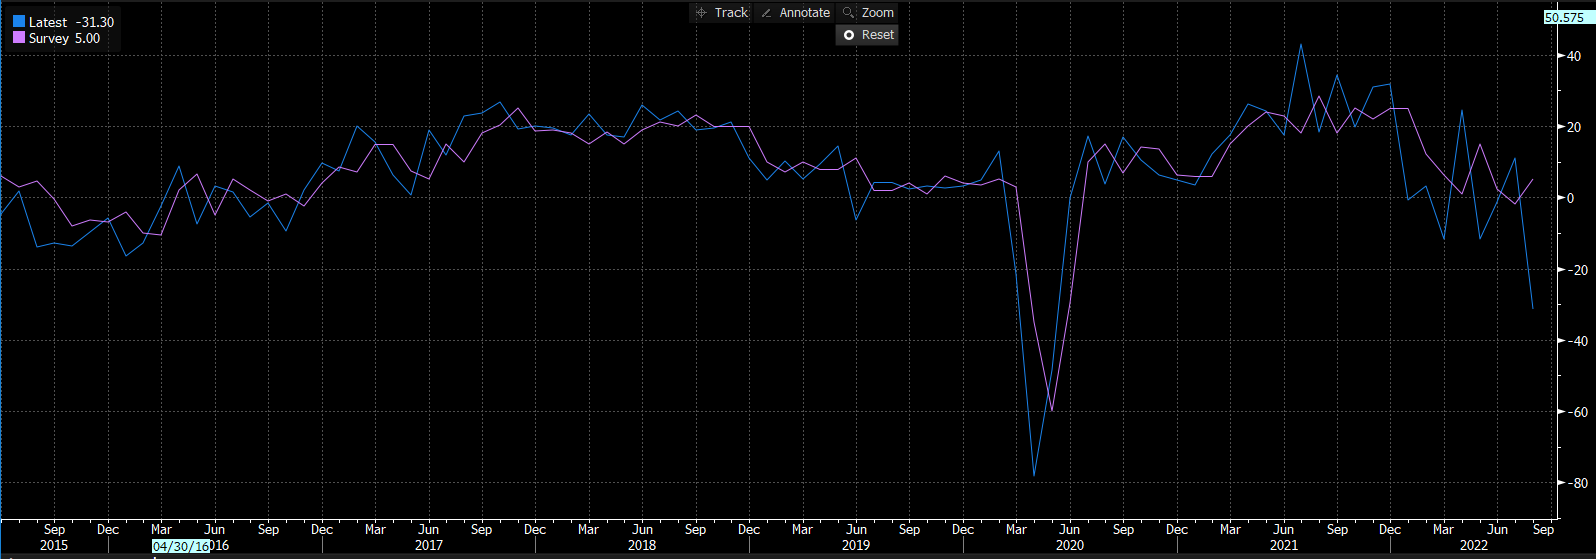
and in US with the Empire Manufacturing falling from 11.1 to -31.3 (est. 5) charted below and a weak data on housing market too (NAHB Housing Market from 55 to 49:
Part 2: the second part of the week started with positive news coming from China, where more stimulus is expected (there is a new plan of 200bln emissions from local authority to invest in infrastructure) but we had a series of negative news relative to inflation:
UK CPI: Headline CPI 10.1% from 9.4% & vs consensus 9.8% Core CPI 6.2% from 5.8% & vs consensus 5.8% (we need to back 32 years to see a level of inflation in double figures);
PPI in Germany: YoY 32.2% (esp. 31.8%) and MoM 5.3% (esp. 0.6%);
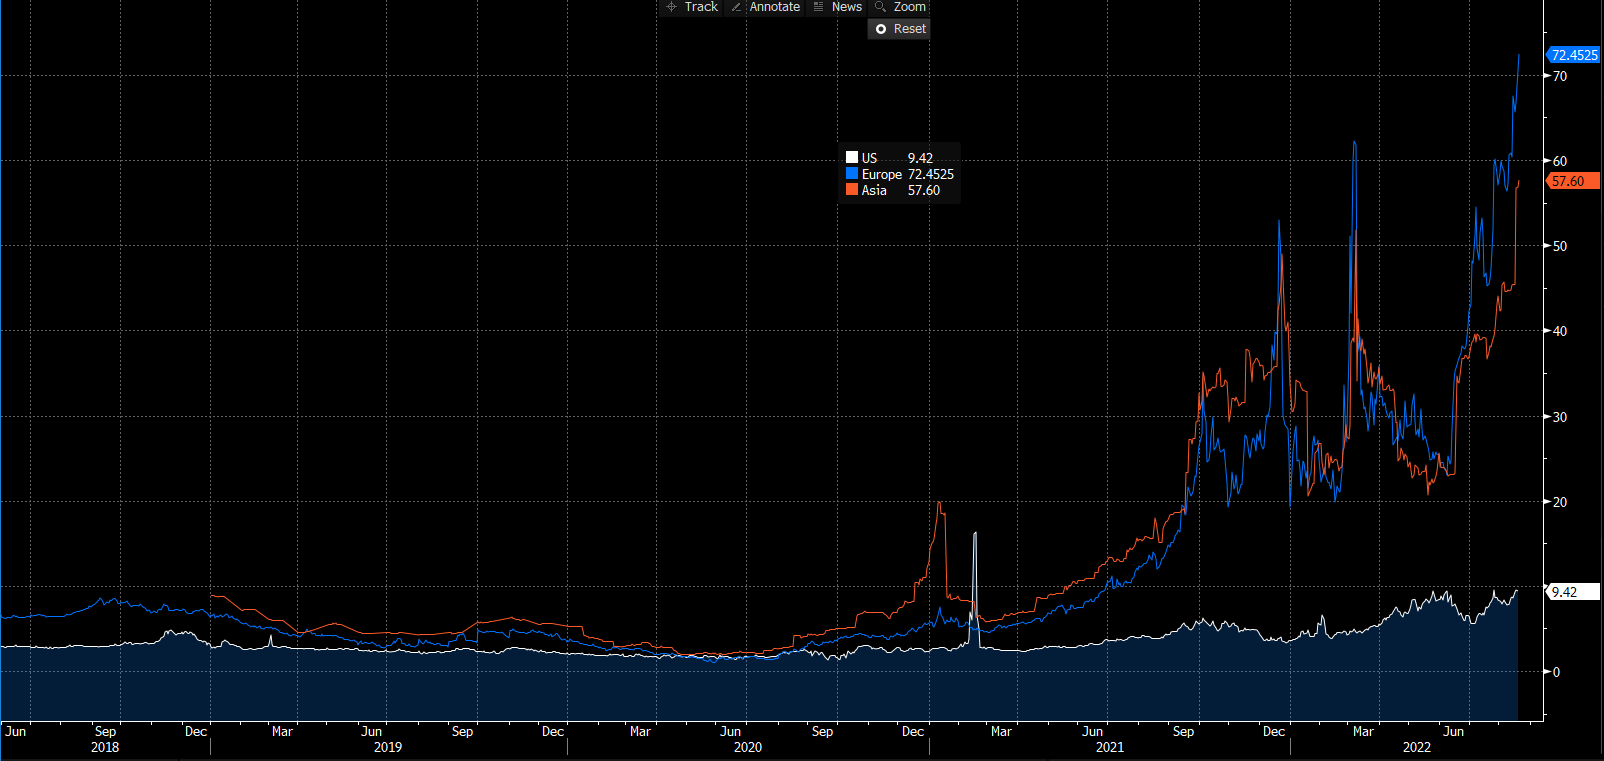
European gas prices that continue to rise due Russia/Ukraine conflict (and Moscow supply reduction on all major pipeline) and abnormally high and extended dry. Below I compared the price in Europe, Asia and US in btu (the heat content of each energy source) to have a better undestanding of the growth pressure Eu and Asia have.
FED minutes: nothing new on that but they confirmed that going forward the hike path will slow (from 75bp at each meeting they could pass to 50/25bp) incorporating new informations, but also that inflationary pressure will hard to abate by themself and that they need to mantain for a long time period rates above neutral level
MARKETS:
This week I want to comment each asset class separately, starting from commodities because is the asset class that drives all the other. I like to say that if you undestand commodities, you can try to undestand the market. Commodities players and traders operates with a long term time frame, planning orders in advance so they have a long term visibility that others markets don’t have.
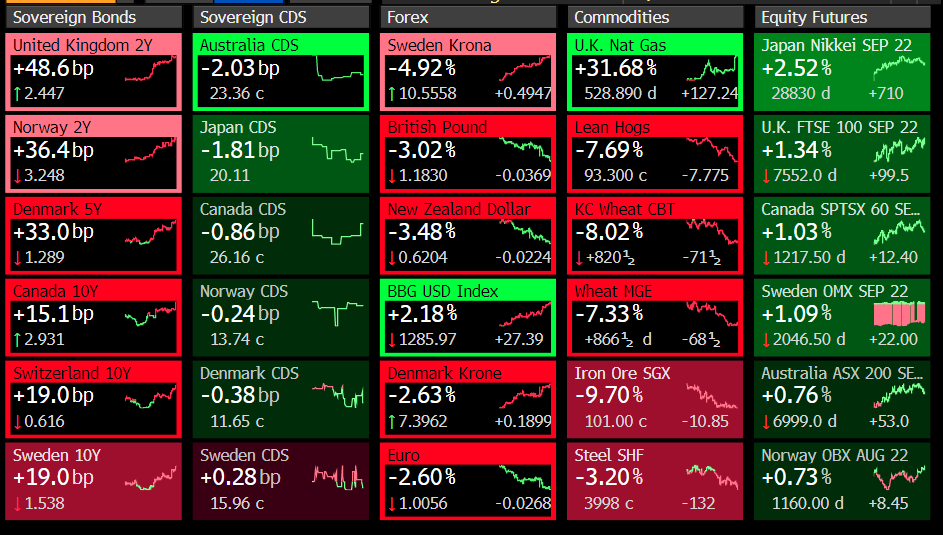
Commodities: we have a great pressure on wheat and grain in general with the strong lightening of COT but we have also the news that ship from Ukraine ports continue despite at a low level compared to the past. Iron ore and Steel were impacted by the growth fear coming from China (we talked above about this) while natural gas spiked again putting. So the commodities market confirm the “stagflation scenario”;
Bonds govies: being a disciple of intermarket analysis (that is the discipline of analysing markets examining the correlations between different asset classes) I use two ratios usually (copper to gold as a proxy for growth and oil to gold as a proxy for inflation). Despite some weakness in industrial metals this week, copper performed well driving up interest rates.
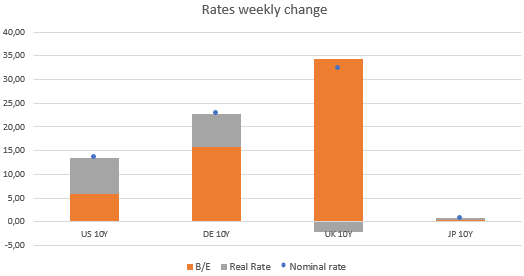
Looking inside the move of interest rates, it’s not a surprise that a big part is associated with an increase of breakeven (especially in UK and in Eurozone). While looking at the yield curve we had a continued flattening on the 5-30 part of the curve, while the 2-5 part steepened (especially in US where if is true that inflation peaked, there will be less hurry to front load all the hike);

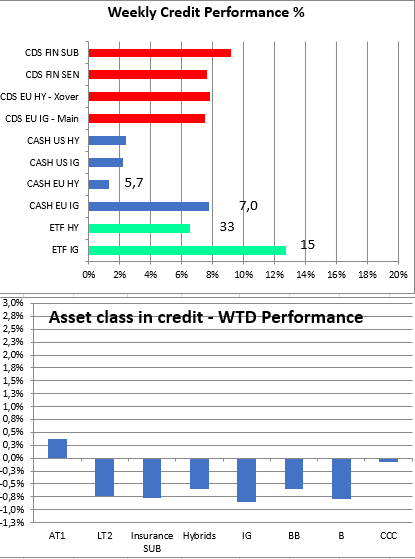
Credit: a selling pressure returned on the credit market after a very strong run. IG (cash and ETF) move was greater than HY, given the rate sensitivity (IG widended 7bp while HY 5bp). The move in CDS in almost equal adjusted for volatility, with more pressure (in % term on subordinated paper).
The move is great if we look at implicit spread inside ETF, a signal that liquidity is very dry and not a lot of trade happened in the market.
Looking at credit (and also equity) from an intermarket point of view we can see that HY (in orange) decoupled from equity market (Stoxx Europe, in blue). The most negative signal for me is also the decoupling of the IG/Govt ratio, an indicator of liquidity that it is drying putting pressure on equity and risky assets in general. If we look at the HY/IG ratio it seems that HY is living in la-la-land and is not pricing at all a risk of recession. Give credit to credit!

Equity: on liquidity and fundamentals I have nothing to add here, deep down these variables are the same for all risky assets. So I want to spend some time on technicals (below the sum-up of Macro Ops, follow them on twitter too).
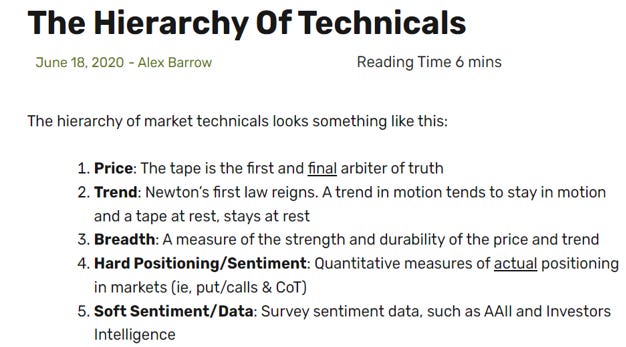
Long term trend (if we use the moving average at 200 days) continue to remain down but price action and momentum is up (below the MACD on the daily ES1). MA200 acted like a wall for price action this week but breadth recovered from the depressed level we saw in the past 2 months (with more names above moving average 50 days) with the move driven by the most cyclical name.


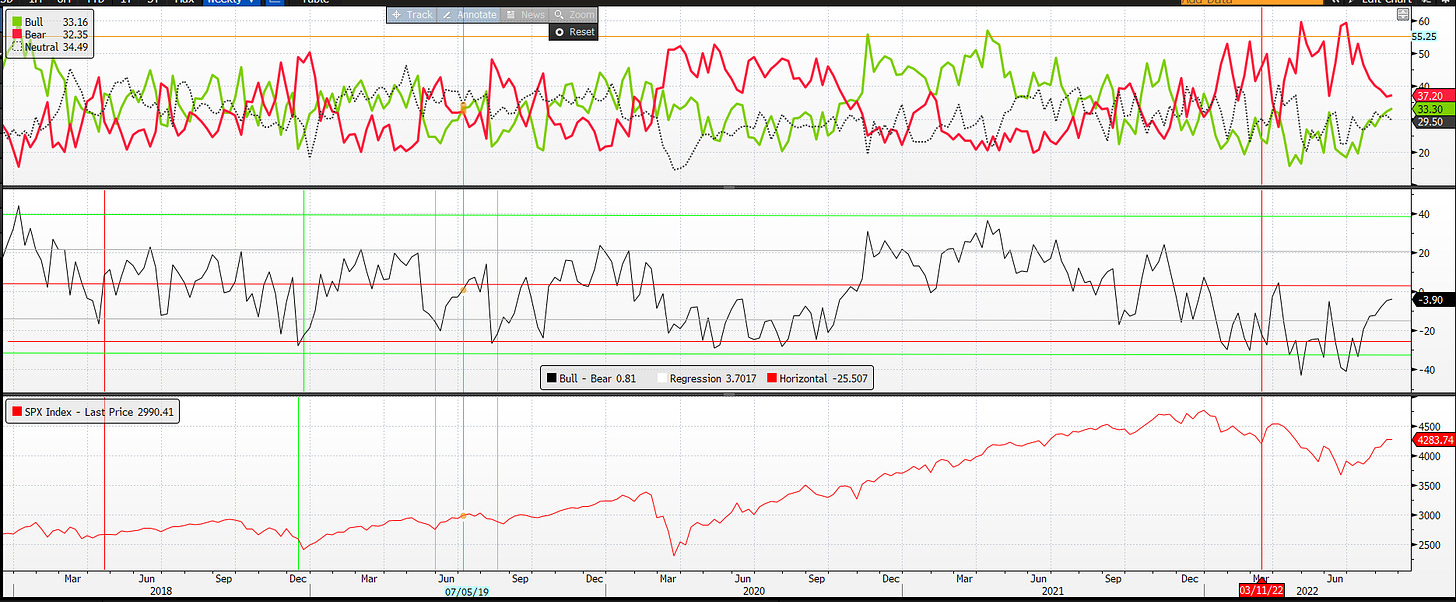
Looking finally at positioning/sentiment, bearish sentiment (using AAII) is lower than in the past and the difference between bull and bear is now more neutral. In fact with price rising (and positive momentum) and volatility compressed more players (systematic, CTA) runned to buy, cutting short position.


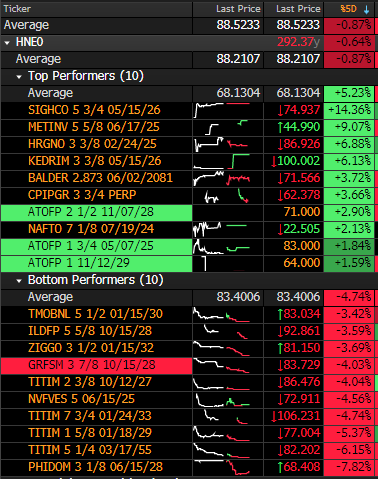
MICRO: HY market this week had a lot of idiosyncratic movements given we are yet in the reporting season. Starting from the winners we have:
SIGHCO: Upfield Sigma, the margarine maker KKR-backed, told investors that an operational turnaround is at play, reporting strong earnings and reporting having hedged all edible oil needs for 2022. Revenue grew 20% yoy, but margin fell 5%.
HRGNO: strong performance after the announcement of a shareholder loan for 55M and some covenants relaxation;
KEDRIM: the company announced the redemption of the bond after the EU green light of the Permira acquisition
While in the losers we had:
PHIDOM: Philps Domestic with weak reporting given macro environment in China and a deteriorating cash balance.
TITIM: some profit taking after last week, but basically associated with rising rates putting pressure on BB names (more sensitive one)
It’s all for today. If you enjoyed my job/analysis feel free to forward it to friends/colleague and remember to subscribe to the newsletter.
See you in 2 weeks when I’ll go back. Bye Bye.
Is there any correlation between CDS and FX?