
Weekly Market Review - 03 Feb
Weekly Market Review - 03 Feb
A thread from macro to micro

Welcome back at the weekly recap, as usual at the end of the week. As always if you like my job/analysis please subscribe below and share it and I remember you that I am also on twitter at @Credit_Junk. And now let’s see what happened this week.
MACRO/NARRATIVE: During the week we had a lot of data and market has struggled to absorb them all.
Starting from euro area in most countries we had a stable manufacturing PMI for January but a rebound in the service sectors (confirming for most of the investor their “soft landing narrative”). We had also the preliminary HICP inflation data (without the Germany that accounts for almost 25%) that confirmed a softening in inflationary pressure from 9.2% to 8.5% (basically due to a softening in energy prices). In fact the core inflation (ex energy and food) remained stable at 5.2%. This component is more sticky and related to job market.
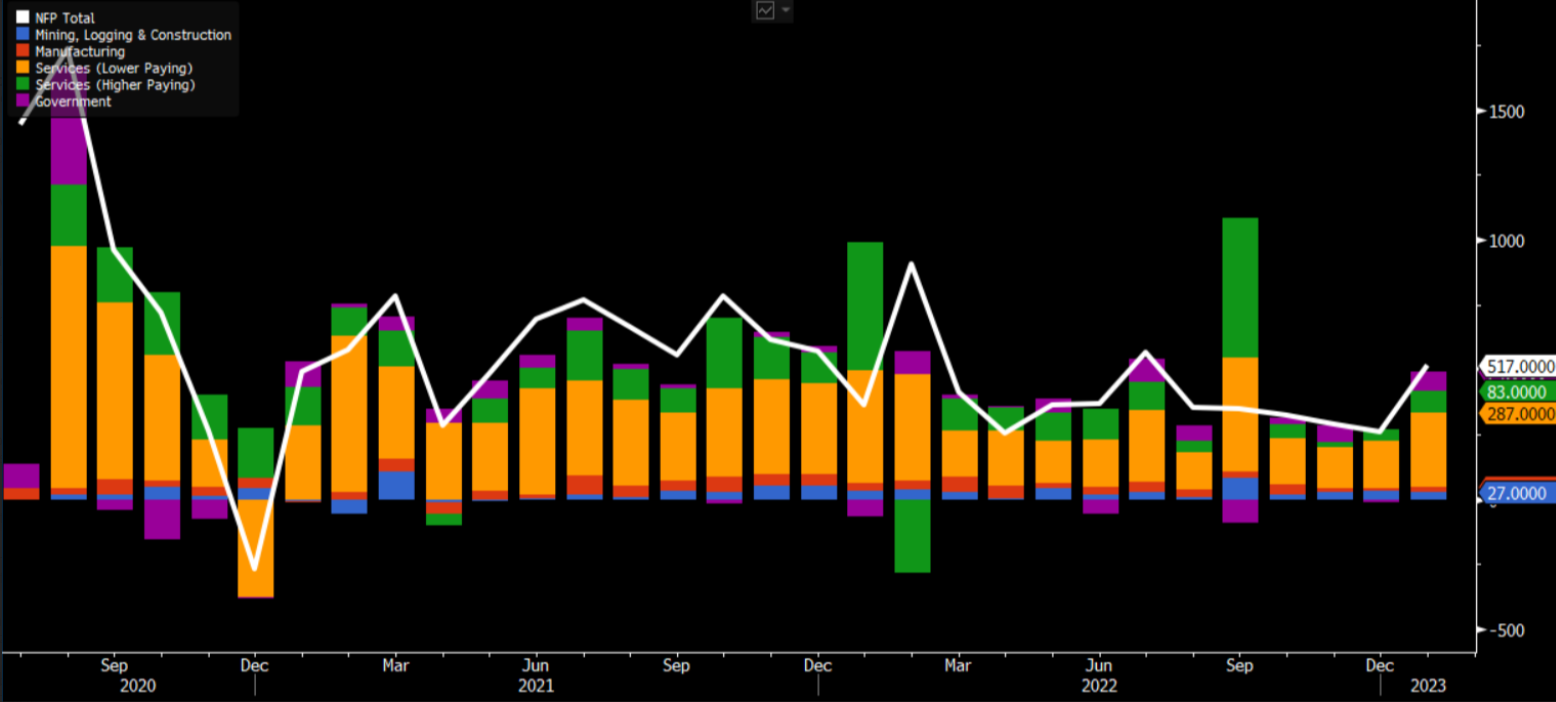
In the United States the ISM manufacturing was mixed with orders continuing to fall and price paid returning to growth. Ths ISM services (out today) rose to 55.2 vs 49.2; (EST. 50.5) and with new orders bouncing from 45.2 to 60.4. While the publication of the ECI index (an aggregate indicator for salaries and wages) showed a growth of 1% in 4Q of the 2022 but a sequential decline, confirming the top in the wages pressures. But the non farm payroll published today continues to show a very tight job market with an increase of 517K new jobs vs an expectation for 188k. While most of the increase is related to services with lower paying, like most of the time, this time could be an indication of tech layoff being absorbed faster than in the past, forcing the FED to go ahead more than most think.
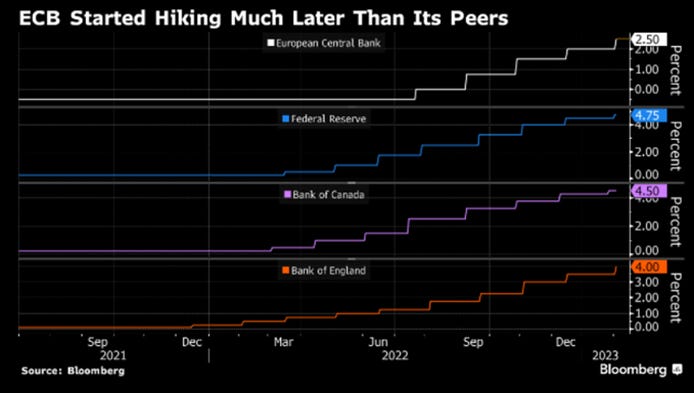
But this was without doubts the “Central banks week” with from the Fed, the BOE and the ECB. The Fed, lifted target rate by 25bp (to a range of 4.5%-4.75%) after 4 hikes of 75bp and 1 of 50bp. Powell said that furter increases (multiples) are coming to restore price stability, but at the same time inflation remains elevated but has started to ease. The catalist for a dovish readness was the no pushback agains easing of financial conditions, with Powell affirming that if inflation fall faster then expected they could open the door to market pricing of OIS curve (now diverging from DOTS and pricing cuts starting in 2023 yet).
Also the BOE delivered a 50bp hike saying more hikes needed if there will be evidence of more inflationary pressures. For the moments their forecasts shows inflation should fall sharply to around 4% by the end of the year and that country is in recession yet (that will be shorter and milder). Market price now a downshift starting from March.
ECB hiked by 50bp as expected and pre-committed to hike also by 50bp in March. But while with an hand they used a forward guidance, with the other said that inflation data are softening on the headline (while core remain high) and risk are now more balanced. She added also that will use a more data-dependent approach. This, together with the BOC, BOE and FED sending a signal of softening aggresivness was enough for the market to read it as dovish.ECB tried to remain hawkish in a group of other central banks waning aggresivness. Why? ECB started later than peers and they know it's impossible to continue rising rates when others will start to cut.
MARKETS:
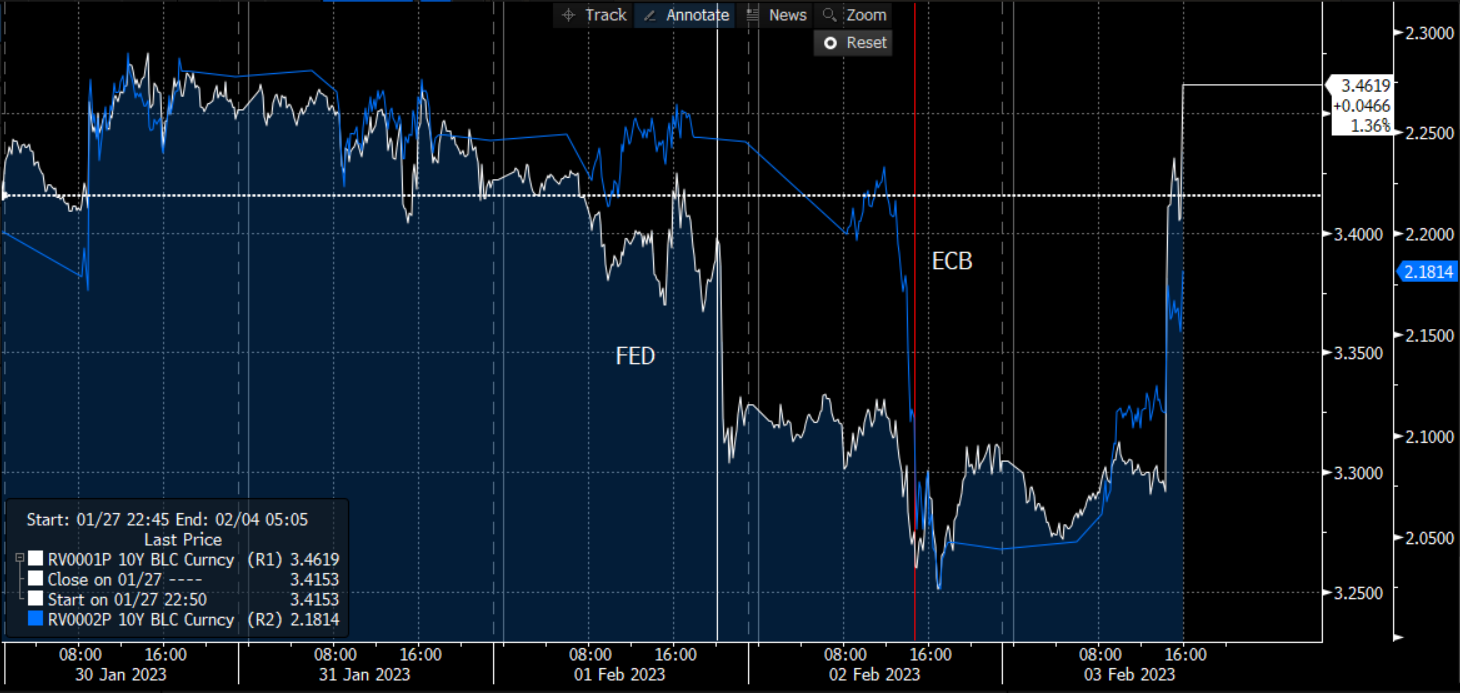
The rates market looks like a patient with bipolar disorder. In the first part of the week, with a “supportive” ECI data on wages and the FED/ECB (both read as dovish), the 10y USA and GER declined to 3.25% and 2%. For Germany the 2% is for me a bottom for fair value (in the bottom chart the regression vs 1y1y Eonia) given a terminal rate that could be between 3.25/3.50%.
Today, after the strong payroll number and the rebound in the ISM services (that means that Q1 GDP could be around 1.5/1.8%) pushed rates back up again, killing expectations of a premature cuts cycle by the FED.
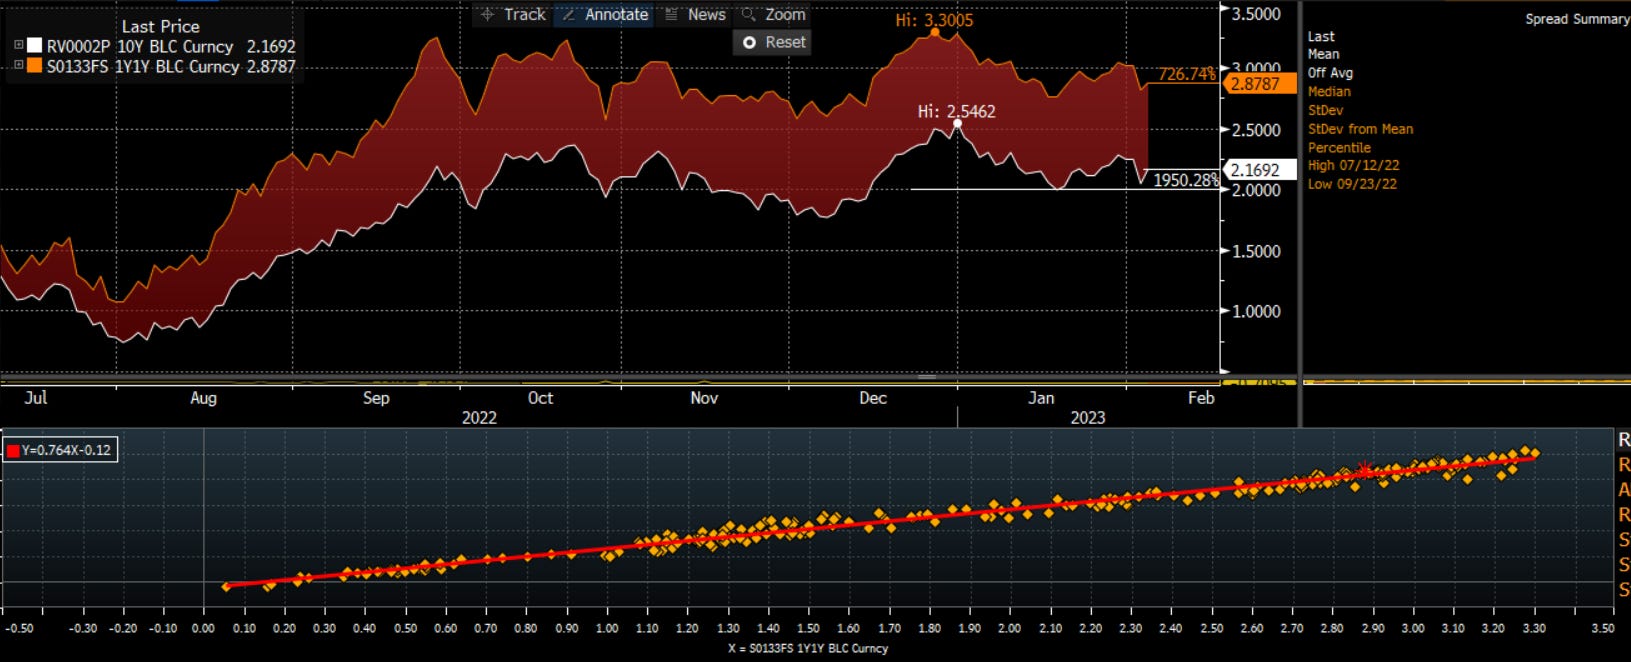
I want to focus one minute also on curve trades (a bit fixed income nerdy but important). While a big focus was on the flattening/inversion of the curve (both in USA and Germany) and their miraculous forecasting ability look for one moment the EUR OIS curve (no issuer risk below, basically a proxy of risk vs ECB). Curve is basically confirming only we are in the late cycle of the hiking cycle. If we look at 1y1y Eonia in in panel below we passed the peak in hawkishness of the ECB (but not necessarily the peak in rates). Exacly there the long-term of the curve (10-30 started to steep, with 5/30 together) signaling that in the near future some form of cuts will come. The short term of the curve (2-5) is more related to monetary policy and is the last part of the curve that steep. For me this is a great indicator that this year is the year for steepening positions.

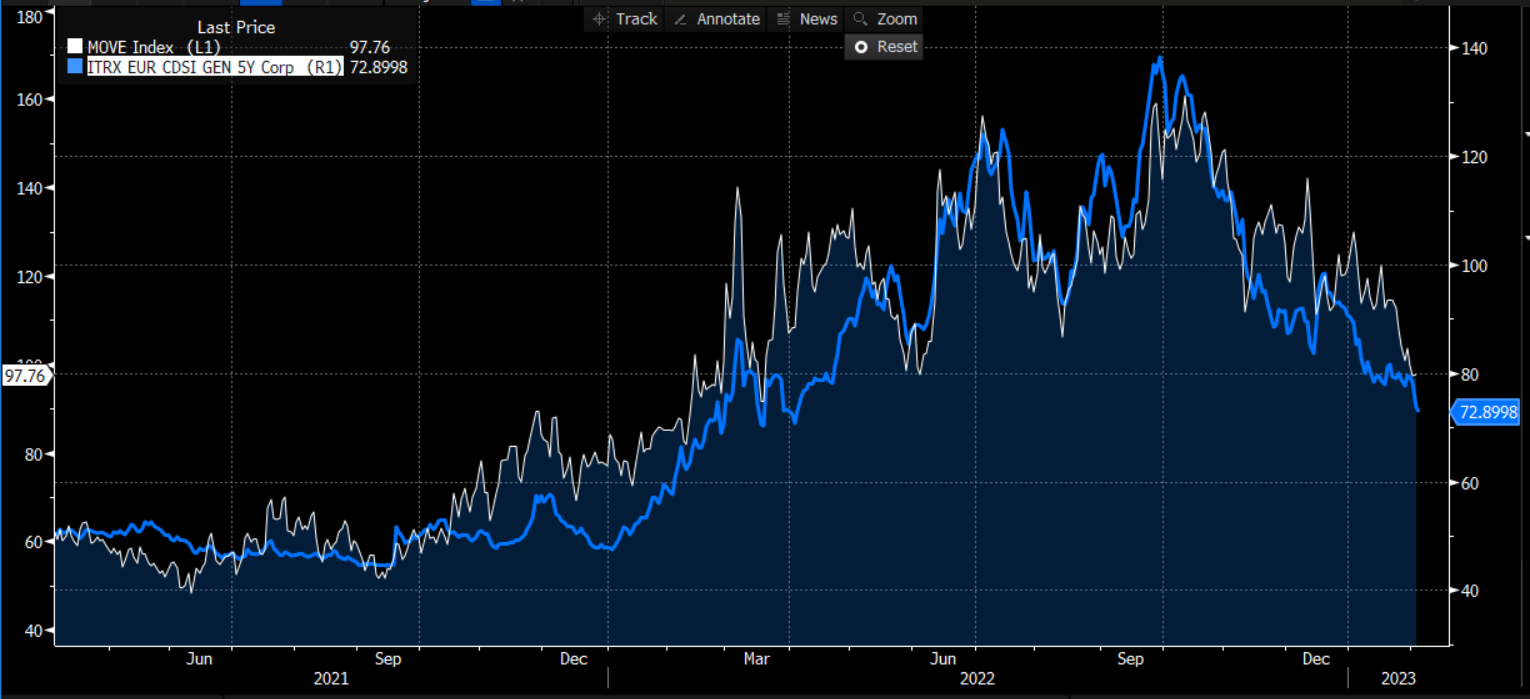
For credit markets, a better than feared growth environment (better PMI data and growing surprise index) together with softening of inflationary pressure and an almost done hiking cycle by the most central bankers helped to calm volatility (below the MOVE, the VIX for bonds), and supported all the carry trade (below the ITRAX Main IG, but the considerations are valid also for peripherals bond). In the middle of the reporting season the supply remained low, so cash outperformed syntetics. IG tightened by 7bp, while HY by 24bp.

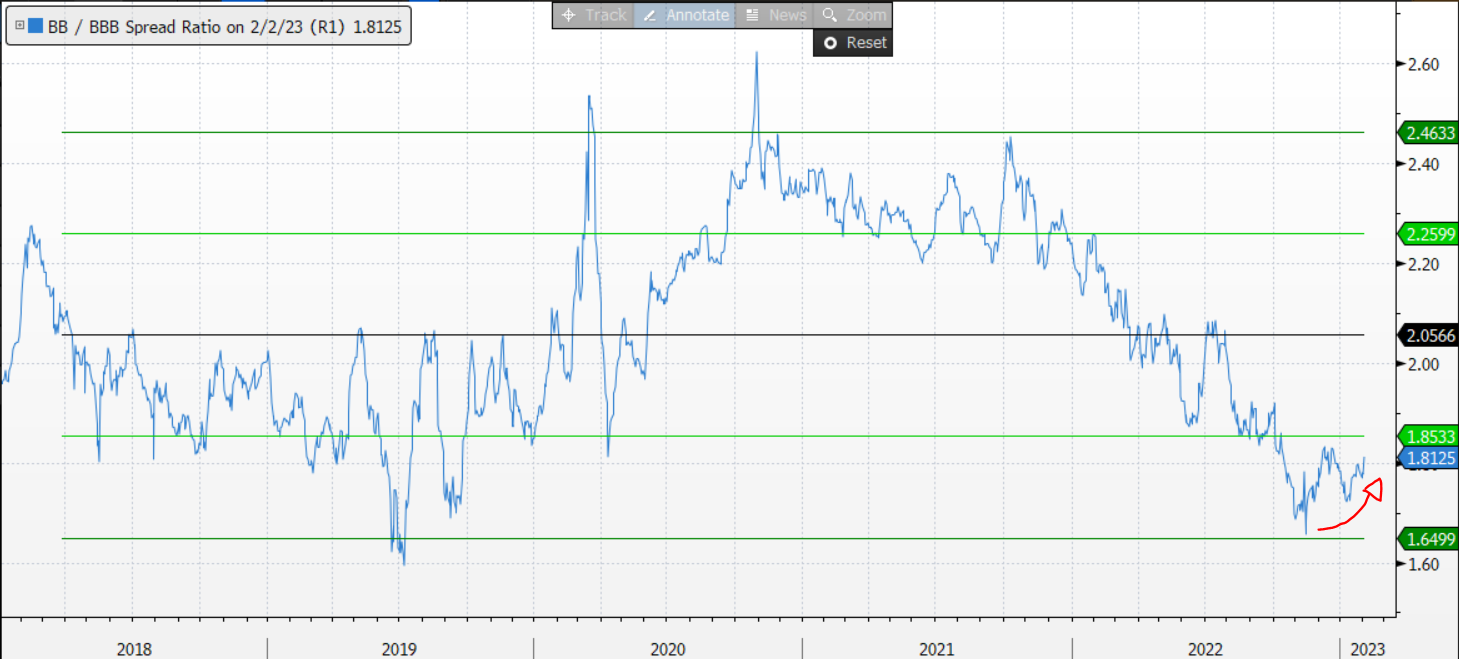
Taking a standard measure of compression (BB/BBB spreads for euro area) we can see that after reaching a -2sd richness we are now seeing some de-compression between the two. With central banks almost seen near the end of their job, investors shifted their focus from inflation to growth and given the high level of interest rates they started to prefer IG (this week IG outperformed HY, beta adjusted).
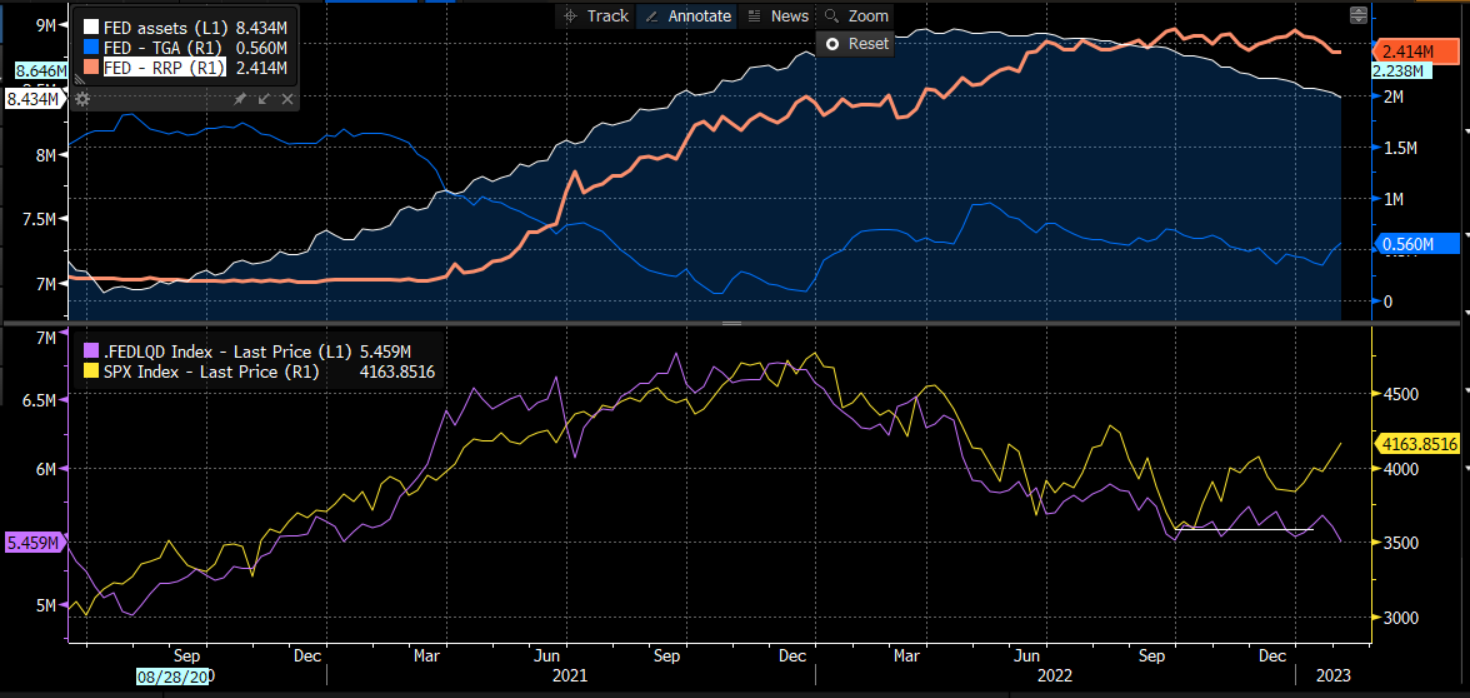
Also equity market had a volatile week (especially NASDAQ, following bonds from +3% to -2% in two days). S&P is now 2% WTD while SXXP +1%. Basically from a macro point of view we are seeing better economic data than feared (especially on services) and liquidity environment remained supporting since September (thanks to a decresing TGA which balanced a decreasing assets).
Also looking at others liquidity indicators, the IG/Govt ratio (below for EZ vs SXXP, a measure of health state of credit market) continued to go up, confirming the direction of travel.

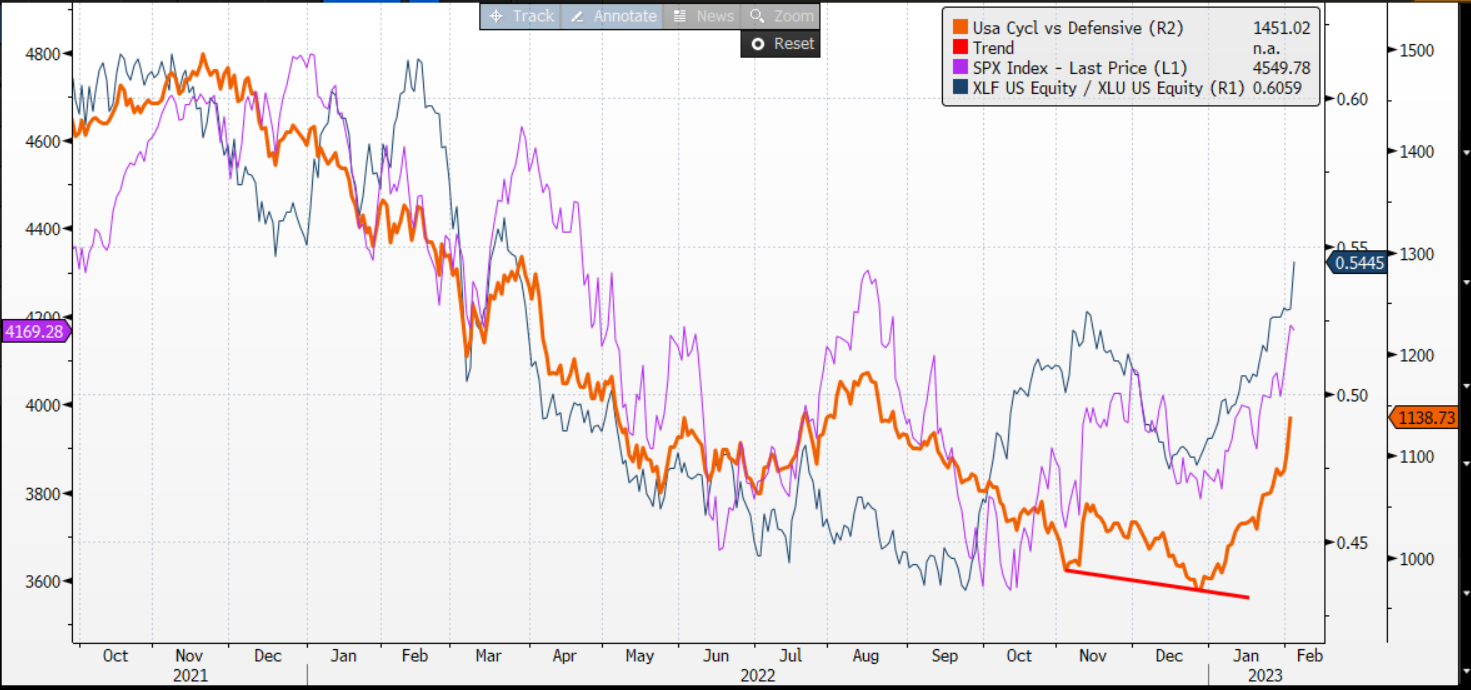
From an internal point of view (Stanley Druckenmiller said that the best economist is inside the market) several cyclical/defensive, financials/utilities, confirmed the goodness of this rebound (at least for the moment).
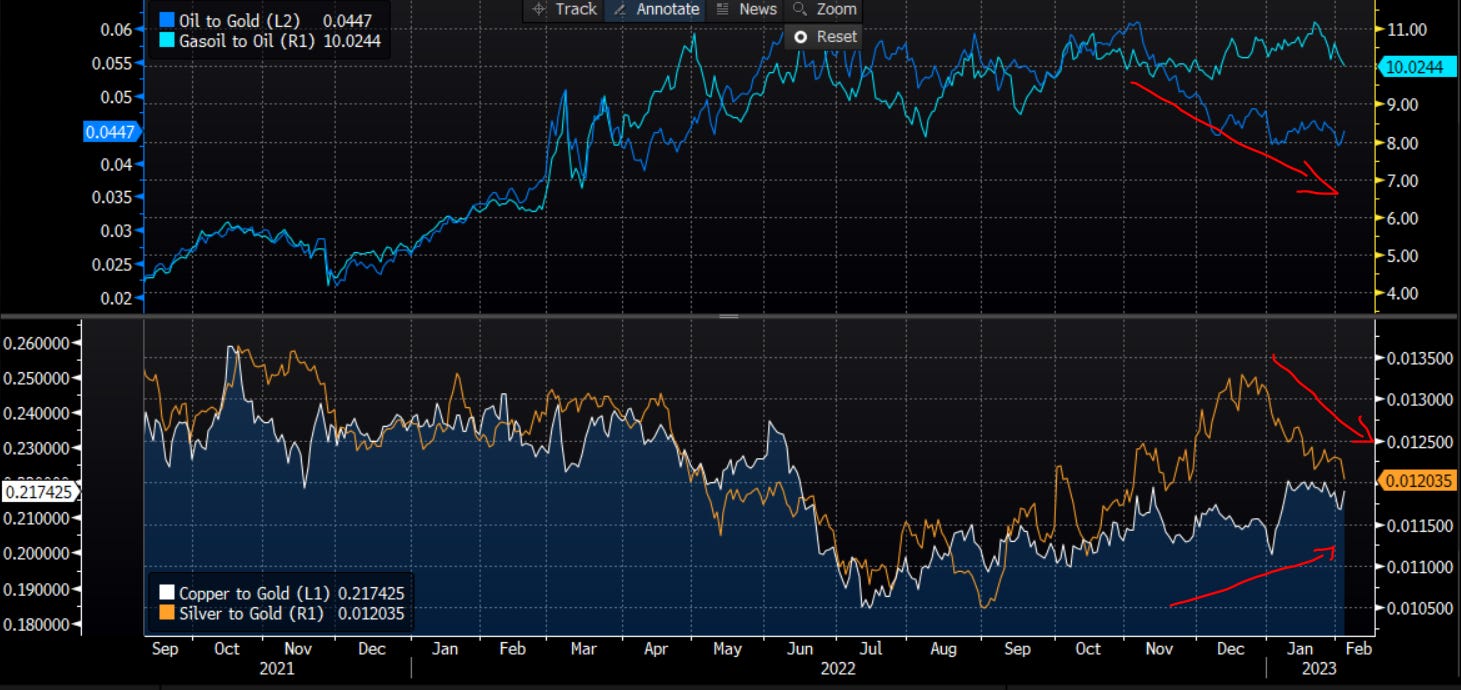
I want to conclude with some internal of commodities market too. In the first panel we have a focus on energy market with oil to gold declining due to fear of lower demand despite a China reopening, while gasoil/oil (a measure of refining margin, despite usually I prefer to use crack spreads) remaining stable due to some capacity constrain in refining capacity and the start of oil products embargo coming from Russia. Passing now on metals, we can see that the spike in Silver/Gold (usually a ciclical indicator) is now totally reabsorbed but the trend in copper/gold (an indicator of industrial metal demand) continue to go up, thanks to a high structural demand for copper for green transition, the reopening story in China and the geopolitical problem in Perù.
MICRO:
On the micro part I want to focus on some big movement and special situation stories:
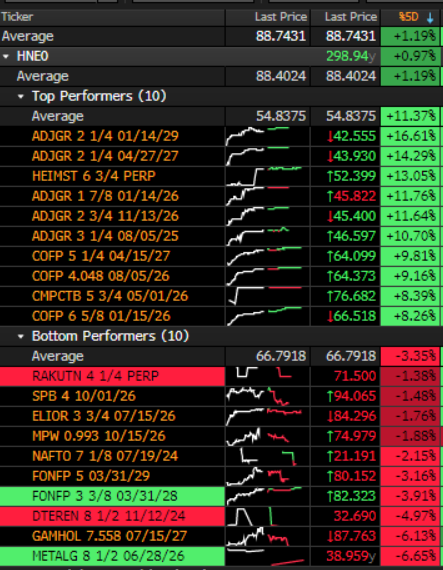
ADJGR/ADLER: strong rebound after a Bloomberg story related to a alternative “Restructuring Plan” proposed from a group of bondholders that refused the original plan
COFP (Casino): the bonds rebounded strongly after the issuer confirmed it was in exploratory discussions with Teract, regarding a possible combination of its French operations
It’s all for today. I hope you enjoyed my job/analysis. Feel free to forward it to friends/colleague and remember to subscribe to the newsletter.
compact, txvm, gd we!
great take, thank you!